eBay 2013 Annual Report Download - page 71
Download and view the complete annual report
Please find page 71 of the 2013 eBay annual report below. You can navigate through the pages in the report by either clicking on the pages listed below, or by using the keyword search tool below to find specific information within the annual report.-
 1
1 -
2
-
3
-
4
-
5
-
6
-
7
-
8
-
9
-
10
-
11
-
12
-
13
-
14
-
15
-
16
-
17
-
18
-
19
-
20
-
21
-
22
-
23
-
24
-
25
-
26
-
27
-
28
-
29
-
30
-
31
-
32
-
33
-
34
-
35
-
36
-
37
-
38
-
39
-
40
-
41
-
42
-
43
-
44
-
45
-
46
-
47
-
48
-
49
-
50
-
51
-
52
-
53
-
54
-
55
-
56
-
57
-
58
-
59
-
60
-
 61
61 -
 62
62 -
 63
63 -
 64
64 -
 65
65 -
 66
66 -
 67
67 -
 68
68 -
 69
69 -
 70
70 -
 71
71 -
 72
72 -
 73
73 -
 74
74 -
 75
75 -
 76
76 -
 77
77 -
 78
78 -
 79
79 -
 80
80 -
 81
81 -
82
-
83
-
84
-
85
-
86
-
87
-
88
-
89
-
90
-
91
-
92
-
93
-
94
-
95
-
96
-
97
-
98
-
99
-
100
-
101
-
102
-
103
-
104
-
105
-
106
-
107
-
108
-
109
-
110
-
111
-
112
-
113
-
114
-
115
-
116
-
117
-
118
-
119
-
120
-
121
-
122
-
123
-
124
-
125
-
126
-
127
-
128
-
129
-
130
-
131
-
132
-
133
-
134
-
135
-
136
-
137
-
138
-
139
-
140
-
141
-
142
-
143
-
144
-
145
-
146
-
147
-
148
-
149
-
150
-
151
-
152
-
153
-
154
-
155
-
156
-
157
-
158
-
159
-
160
-
161
-
162
-
163
-
164
-
165
-
166
-
167
 |
 |

Payments net transaction revenues increased $1 billion, or 25%, during 2012 compared to 2011, due primarily to net TPV growth of 22%
and a higher take rate. The increase in net TPV was due primarily to growth in consumer and merchant adoption and use of PayPal both on and
off eBay. Our Merchant Services net TPV increased 25% during 2012 compared to 2011, and represented 67% of PayPal's net TPV in 2012
compared with 65% in 2011. On eBay net TPV increased 16% during 2012 compared to 2011, and represented 33% of PayPal's net TPV in
2012. The increase in the take rate was driven primarily by foreign exchange income, gains from hedging activities and the full year impact from
our acquisition of Zong (acquired in August 2011).
Payments net transaction revenues earned internationally totaled $3.4 billion , $2.8 billion and $2.2 billion in 2013 , 2012 and 2011 ,
representing 56% , 55% and 53% of total Payments net transaction revenues, respectively. The increase in international net transaction revenues
as a percentage of total Payments net transaction revenues was due primarily to higher growth in Merchant Services net TPV outside the U.S. as
we expanded merchant coverage and consumer share of checkout.
Enterprise Net Transaction Revenues
Enterprise net transaction revenues increased $48 million , or 6% , in 2013 compared to 2012 , due primarily to an increase in
Merchandise Sales of 14% , partially offset by a lower take rate.
Enterprise net transaction revenues were $850 million in 2012 and $460 million in 2011. Net transaction revenues attributable to the
Enterprise segment for 2011 are reflected from June 17, 2011 (the date the acquisition of GSI was completed). Accordingly, comparisons of
Enterprise's net transaction revenues for 2012 to 2011 are not meaningful.
Marketing Services and Other Revenues
Marketing services and other revenues increased $270 million , or 13% , in 2013 compared to 2012 , and represented 14% of total net
revenues for both periods. The increase in marketing services and other revenues was due primarily to growth in our Bill Me Later portfolio of
receivables from loans, as well as increased revenue from our advertising business.
Marketing services and other revenues increased $382 million, or 23%, in 2012 compared to 2011, and represented 14% of total net
revenues for both periods. The increase in marketing services and other revenues was due primarily to growth in our Bill Me Later portfolio of
receivables from loans, as well as increased revenue from our advertising business.
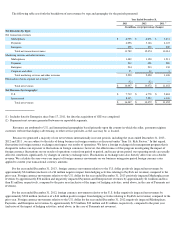
Summary of Cost of Net Revenues
The following table summarizes changes in cost of net revenues for the periods presented:
67
Year Ended December 31,
Change from
2012 to 2013
Change from
2011 to 2012
2013
2012
2011
in Dollars
in %
in Dollars
in %
(In millions, except percentages)
Cost of net revenues:
Marketplaces
$
1,520
$
1,273
$
1,210
$
247
19
%
$
63
5
%
As a percentage of total Marketplaces net revenues
18.3
%
17.2
%
18.2
%
Payments
2,675
2,209
1,866
466
21
%
343
18
%
As a percentage of total Payments net revenues
40.4
%
39.6
%
42.3
%
Enterprise
(1)
821
696
374
125
18
%
322
N/A
As a percentage of total Enterprise net revenues
73.8
%
64.2
%
63.4
%
Corporate and other
20
38
11
(18
)
(47
)%
27
N/A
Total cost of net revenues
$
5,036
$
4,216
$
3,461
$
820
19
%
$
755
22
%
As a percentage of net revenues
31.4
%
30.0
%
29.7
%
(1) Cost of net revenues attributable to the Enterprise segment for 2011 are reflected from June 17, 2011 (the date the acquisition of GSI was
completed). Accordingly, the percent changes in Enterprise's cost of revenues between 2011 and 2012 are not meaningful.