Cogeco 2014 Annual Report Download - page 19
Download and view the complete annual report
Please find page 19 of the 2014 Cogeco annual report below. You can navigate through the pages in the report by either clicking on the pages listed below, or by using the keyword search tool below to find specific information within the annual report.-
 1
1 -
2
-
3
-
4
-
5
-
6
-
7
-
8
-
 9
9 -
 10
10 -
 11
11 -
 12
12 -
 13
13 -
 14
14 -
 15
15 -
 16
16 -
 17
17 -
 18
18 -
 19
19 -
 20
20 -
 21
21 -
 22
22 -
 23
23 -
 24
24 -
 25
25 -
 26
26 -
 27
27 -
 28
28 -
 29
29 -
30
-
31
-
32
-
33
-
34
-
35
-
36
-
37
-
38
-
39
-
40
-
41
-
42
-
43
-
44
-
45
-
46
-
47
-
48
-
49
-
50
-
51
-
52
-
53
-
54
-
55
-
56
-
57
-
58
-
59
-
60
-
61
-
62
-
63
-
64
-
65
-
66
-
67
-
68
-
69
-
70
-
71
-
72
-
73
-
74
-
75
-
76
-
77
-
78
-
79
-
80
-
81
-
82
-
83
-
84
-
85
-
86
-
87
-
88
-
89
-
90
-
91
-
92
-
93
-
94
-
95
-
96
-
97
-
98
-
99
-
100
-
101
-
102
-
103
-
104
-
105
 |
 |

18 COGECO CABLE INC. 2014 MD&A
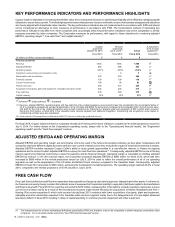
KEY PERFORMANCE INDICATORS AND PERFORMANCE HIGHLIGHTS
Cogeco Cable is dedicated to increasing shareholder value and consequently focuses on optimizing profitability while efficiently managing capital
utilization to secure future growth. The following key performance indicators are closely monitored to ensure that business strategies and objectives
are closely aligned with shareholder value creation. The key performance indicators are not measurements in accordance with IFRS and should
not be considered an alternative to other measures of performance in accordance with IFRS. The Corporation's method of calculating key
performance indicators may differ from other companies and, accordingly, these key performance indicators may not be comparable to similar
measures presented by other companies. The Corporation measures its performance, with regard to these objectives by monitoring adjusted
EBITDA, operating margin(1), free cash flow(1) and capital intensity(1).
Original
projections
October 30, 2013
Revised
projections
July 9, 2014(1) Actual
Achievement
of the revised
projections(2)
Fiscal 2014 Fiscal 2014 Fiscal 2014 Fiscal 2014
(in millions of dollars, except percentages) $ $ $
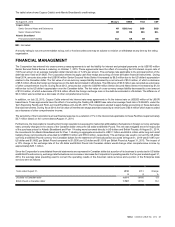
Financial guidelines
Revenue 1,935 1,955 1,948
Adjusted EBITDA 885 895 893
Operating margin 45.7% 45.8% 45.9%
Integration, restructuring and acquisition costs — 4 5
Depreciation and amortization 470 470 460
Financial expense 130 130 130
Current income taxes 100 96 83
Profit for the year 230 210 209
Acquisitions of property, plant and equipment, intangible and other assets 425 425 415
Free cash flow 230 240 275
Capital intensity 22% 22% 21%
: Achieved : Under-achieved : Surpassed
(1) Revenue, adjusted EBITDA, operating margin and free cash flow of the original projections were revised to take into consideration the overall performance of
all of our operating segments as well as the appreciation of the US dollar and British Pound currency compared to the Canadian dollar. Current income taxes
and profit for the year of the original projections were revised considering the impairment of property, plant and equipment of $32.2 million which occurred
during the third quarter of fiscal 2014 in the Canadian cable services segment and additional integration, restructuring and acquisitions costs related to
restructuring activities were also considered.
(2) Achievement of the projections is defined as within 3% above or below the projected amount.
For fiscal 2014, Cogeco Cable achieved or surpassed virtually all of its key performance indicators compared to its revised projections issued on
July 9, 2014. For further details on the Corporation's operating results, please refer to the “Operating and financial results”, the "Segmented
operating results" and the "Cash flow analysis" sections.
ADJUSTED EBITDA AND OPERATING MARGIN
Adjusted EBITDA and operating margin are benchmarks commonly used in the telecommunications industry, as they allow comparisons with
companies that have different capital structures and are more current measures since they exclude the impact of historical investments in assets.
Adjusted EBITDA evolution assesses Cogeco Cable's ability to seize growth opportunities in a cost-effective manner, to finance its ongoing
operations and to service its debt. Adjusted EBITDA is a proxy for cash flow from operations(1). Consequently, adjusted EBITDA is one of the key
metrics used by the financial community to value the business and its financial strength. Operating margin is calculated by dividing adjusted
EBITDA by revenue. In the 2013 annual report, the Corporation projected adjusted EBITDA of $885 million for fiscal 2014, which was then
increased to $895 million in the revised projections issued on July 9, 2014 in order to reflect the overall performance of all of our operating
segments as well as the appreciation of the US dollar and British Pound currency compared to the Canadian dollar. Consequently, adjusted
EBITDA in fiscal 2014 amounted to $893 million, achieving the Corporation's revised projections. The operating margin reached 45.9% in fiscal
2014, compared to the revised projections of 45.8% issued on July 9, 2014.
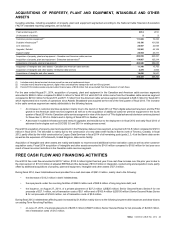
FREE CASH FLOW
Free cash flow is defined as cash flow from operations less acquisitions of property, plant and equipment, intangible and other assets. Furthermore,
the financial community closely monitors this indicator since it measures the Corporation's ability to repay debt, distribute capital to its shareholders
and finance its growth. Fiscal 2014 free cash flow amounted to $275 million, surpassing the Corporation's revised projections mainly due to lower
current income taxes mainly as a result of the favorable tax structure implemented following the acquisitions of Atlantic Broadband and Peer 1
Hosting ("the recent acquisitions") which both occurred during fiscal 2013 combined with lower acquisitions of property, plant and equipment,
intangible and other assets than expected in the Canadian cable services segment mainly due to the delayed launch of a new digital advanced
television platform in fiscal 2015 resulting in delay of capital spending in customer premise equipment and other equipment.
(1) The indicated terms do not have standardized definitions prescribed by IFRS and, therefore, may not be comparable to similar measures presented by other
companies. For more details, please consult the "Non-IFRS financial measures" section.