Cogeco 2014 Annual Report Download - page 90
Download and view the complete annual report
Please find page 90 of the 2014 Cogeco annual report below. You can navigate through the pages in the report by either clicking on the pages listed below, or by using the keyword search tool below to find specific information within the annual report.-
 1
1 -
2
-
3
-
4
-
5
-
6
-
7
-
8
-
9
-
10
-
11
-
12
-
13
-
14
-
15
-
16
-
17
-
18
-
19
-
20
-
21
-
22
-
23
-
24
-
25
-
26
-
27
-
28
-
29
-
30
-
31
-
32
-
33
-
34
-
35
-
36
-
37
-
38
-
39
-
40
-
41
-
42
-
43
-
44
-
45
-
46
-
47
-
48
-
49
-
50
-
51
-
52
-
53
-
54
-
55
-
56
-
57
-
58
-
59
-
60
-
61
-
62
-
63
-
64
-
65
-
66
-
67
-
68
-
69
-
70
-
71
-
72
-
73
-
74
-
75
-
76
-
77
-
78
-
79
-
 80
80 -
 81
81 -
 82
82 -
 83
83 -
 84
84 -
 85
85 -
 86
86 -
 87
87 -
 88
88 -
 89
89 -
 90
90 -
 91
91 -
 92
92 -
 93
93 -
 94
94 -
 95
95 -
 96
96 -
 97
97 -
 98
98 -
 99
99 -
 100
100 -
101
-
102
-
103
-
104
-
105
 |
 |
Consolidated financial statements COGECO CABLE INC. 2014 89
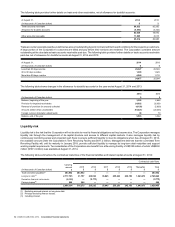
The total expense related to these plans is as follows:
Years ended August 31, 2014 2013
(in thousands of Canadian dollars) $$
(restated, Note 3)
Recognized in:
Operating expenses
Salaries, employee benefits and outsourced services
Current service cost 10,455 9,291
Past service cost 555 —
Financial expense
Other 284 456
11,294 9,747
The following table provides a reconciliation of the change in the defined benefit obligations and plan assets at fair value and a statement
of the funded status at August 31:
Years ended August 31, 2014 2013
(In thousands of Canadian dollars) $$
(restated, Note 3)
Defined benefit obligation
Defined benefit obligation, beginning of the year 30,540 28,811
Current service cost 2,206 1,967
Past service cost 555 —
Interest cost 1,495 1,205
Contributions by plan participants 351 354
Benefits paid (1,488) (471)
Actuarial losses (gains) on obligation arising from:
Experience adjustments (132) 394
Changes in demographic assumptions 318 1,461
Changes in financial assumptions 2,541 (3,181)
Defined benefit obligation, end of the year 36,386 30,540
Plan assets at fair value
Plan assets at fair value, beginning of the year 24,521 17,106
Interest income 1,211 749
Return on plan assets, except amounts included in interest income 3,033 2,173
Administrative expense (146) (140)
Contributions by plan participants 351 354
Employer contributions 4,672 4,750
Benefits paid (1,488) (471)
Plan assets at fair value, end of the year 32,154 24,521
Funded status
Plan assets at fair value 32,154 24,521
Defined benefit obligation 36,386 30,540
Net defined benefit liability 4,232 6,019
The net defined benefit liability is included in the Corporation's consolidated statement of financial position under “Pension plan liabilities
and accrued employee benefits”.