Cogeco 2014 Annual Report Download - page 33
Download and view the complete annual report
Please find page 33 of the 2014 Cogeco annual report below. You can navigate through the pages in the report by either clicking on the pages listed below, or by using the keyword search tool below to find specific information within the annual report.-
 1
1 -
2
-
3
-
4
-
5
-
6
-
7
-
8
-
9
-
10
-
11
-
12
-
13
-
14
-
15
-
16
-
17
-
18
-
19
-
20
-
21
-
22
-
 23
23 -
 24
24 -
 25
25 -
 26
26 -
 27
27 -
 28
28 -
 29
29 -
 30
30 -
 31
31 -
 32
32 -
 33
33 -
 34
34 -
 35
35 -
 36
36 -
 37
37 -
 38
38 -
 39
39 -
 40
40 -
 41
41 -
 42
42 -
 43
43 -
44
-
45
-
46
-
47
-
48
-
49
-
50
-
51
-
52
-
53
-
54
-
55
-
56
-
57
-
58
-
59
-
60
-
61
-
62
-
63
-
64
-
65
-
66
-
67
-
68
-
69
-
70
-
71
-
72
-
73
-
74
-
75
-
76
-
77
-
78
-
79
-
80
-
81
-
82
-
83
-
84
-
85
-
86
-
87
-
88
-
89
-
90
-
91
-
92
-
93
-
94
-
95
-
96
-
97
-
98
-
99
-
100
-
101
-
102
-
103
-
104
-
105
 |
 |

32 COGECO CABLE INC. 2014 MD&A
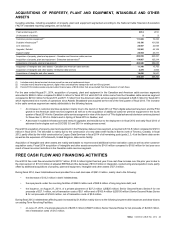
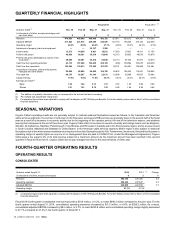
OPERATING EXPENSES
Fiscal 2014 operating expenses amounted to $218.6 million, an increase of 48.3% compared to last year. The increase is mainly due to the full
year impact of Atlantic Broadband acquisition. In addition, the increase is also due to additional PSU and programming costs, the deployment of
TiVo's digital advanced television services in fiscal 2014 as well as marketing initiatives to improve PSU growth and by the appreciation of the
US dollar over the Canadian dollar.
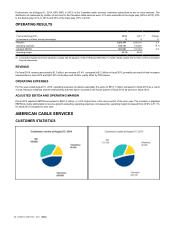
Operating expenses in local currency for fiscal 2014 amounted to US$202.7 million compared to US$144.7 million for fiscal 2013.
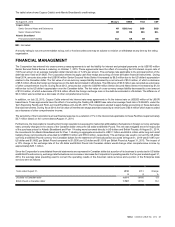
ADJUSTED EBITDA AND OPERATING MARGIN
Fiscal 2014 adjusted EBITDA increased by 43.9% to reach $173.1 million compared to $120.3 million in the prior year as a result of the factors
previously discussed. As a result of operating expenses growth exceeding revenue growth, fiscal 2014 operating margin slightly decreased to
44.2% from 44.9%.
Fiscal 2014 adjusted EBITDA in local currency amounted to US$160.6 million compared to US$118.1 million for the same period last year.
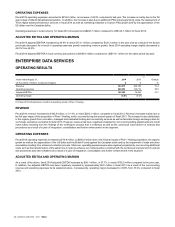
ENTERPRISE DATA SERVICES
OPERATING RESULTS
Years ended August 31, 2014 2013
(1)
Change
(in thousands of dollars, except percentages) $$ %
Revenue 303,075 200,158 51.4
Operating expenses 200,553 125,712 59.5
Adjusted EBITDA 102,522 74,446 37.7
Operating margin 33.8% 37.2%
(1) Fiscal 2013 included seven months of operating results of Peer 1 Hosting.
REVENUE
Fiscal 2014 revenue increased by $102.9 million, or 51.4%, to reach $303.1 million, compared to fiscal 2013. Revenue increased mainly due to
the full year impact of the acquisition of Peer 1 Hosting, which occurred during the second quarter of fiscal 2013. The increase is also attributable
to the organic growth from colocation, managed and dedicated hosting and connectivity services as well as favorable foreign exchange rates for
our foreign operations compared to fiscal 2013. However, revenue has been negatively impacted by non recurring billing adjustments and credit
notes mainly resulting from the findings of the certification process that is underway as well as the continuous improvement of controls and
procedures as a result of a year of integration, consolidation and further enhancement in the segment.
OPERATING EXPENSES
Fiscal 2014 operating expenses increased by $74.8 million, to $200.6 million due to the full year impact of Peer 1 Hosting acquisition, the organic
growth as well as the appreciation of the US dollar and the British Pound against the Canadian dollar and by the impairment of trade and other
receivables resulting from enhanced collection process. Moreover, operating expenses were also negatively impacted by non recurring additional
costs such as the transformation of the sales force in order to enhance our market position combined with the continuous improvement of controls
and procedures and other initiatives as a result of a year of integration, consolidation and further enhancement in the segment.
ADJUSTED EBITDA AND OPERATING MARGIN
As a result of the above, fiscal 2014 adjusted EBITDA increased by $28.1 million, or 37.7%, to reach $102.5 million compared to the prior year.
In addition, the adjusted EBITDA has been negatively impacted by approximately $6.0 million in fiscal 2014 as a result of the non-recurring
revenue and operating expenses items explained above. Consequently, operating margin decreased to 33.8% from 37.2% compared to fiscal
2013.