Cogeco 2014 Annual Report Download - page 30
Download and view the complete annual report
Please find page 30 of the 2014 Cogeco annual report below. You can navigate through the pages in the report by either clicking on the pages listed below, or by using the keyword search tool below to find specific information within the annual report.-
 1
1 -
2
-
3
-
4
-
5
-
6
-
7
-
8
-
9
-
10
-
11
-
12
-
13
-
14
-
15
-
16
-
17
-
18
-
19
-
 20
20 -
 21
21 -
 22
22 -
 23
23 -
 24
24 -
 25
25 -
 26
26 -
 27
27 -
 28
28 -
 29
29 -
 30
30 -
 31
31 -
 32
32 -
 33
33 -
 34
34 -
 35
35 -
 36
36 -
 37
37 -
 38
38 -
 39
39 -
 40
40 -
41
-
42
-
43
-
44
-
45
-
46
-
47
-
48
-
49
-
50
-
51
-
52
-
53
-
54
-
55
-
56
-
57
-
58
-
59
-
60
-
61
-
62
-
63
-
64
-
65
-
66
-
67
-
68
-
69
-
70
-
71
-
72
-
73
-
74
-
75
-
76
-
77
-
78
-
79
-
80
-
81
-
82
-
83
-
84
-
85
-
86
-
87
-
88
-
89
-
90
-
91
-
92
-
93
-
94
-
95
-
96
-
97
-
98
-
99
-
100
-
101
-
102
-
103
-
104
-
105
 |
 |
MD&A COGECO CABLE INC. 2014 29
SEGMENTED OPERATING RESULTS
The Corporation reports its operating results in three operating segments: Canadian cable services, American cable services and Enterprise data
services. The reporting structure reflects how the Corporation manages the business activities to make decisions about resources to be allocated
to the segment and to assess its performance.
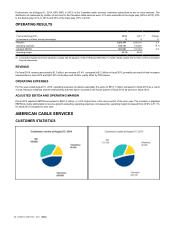
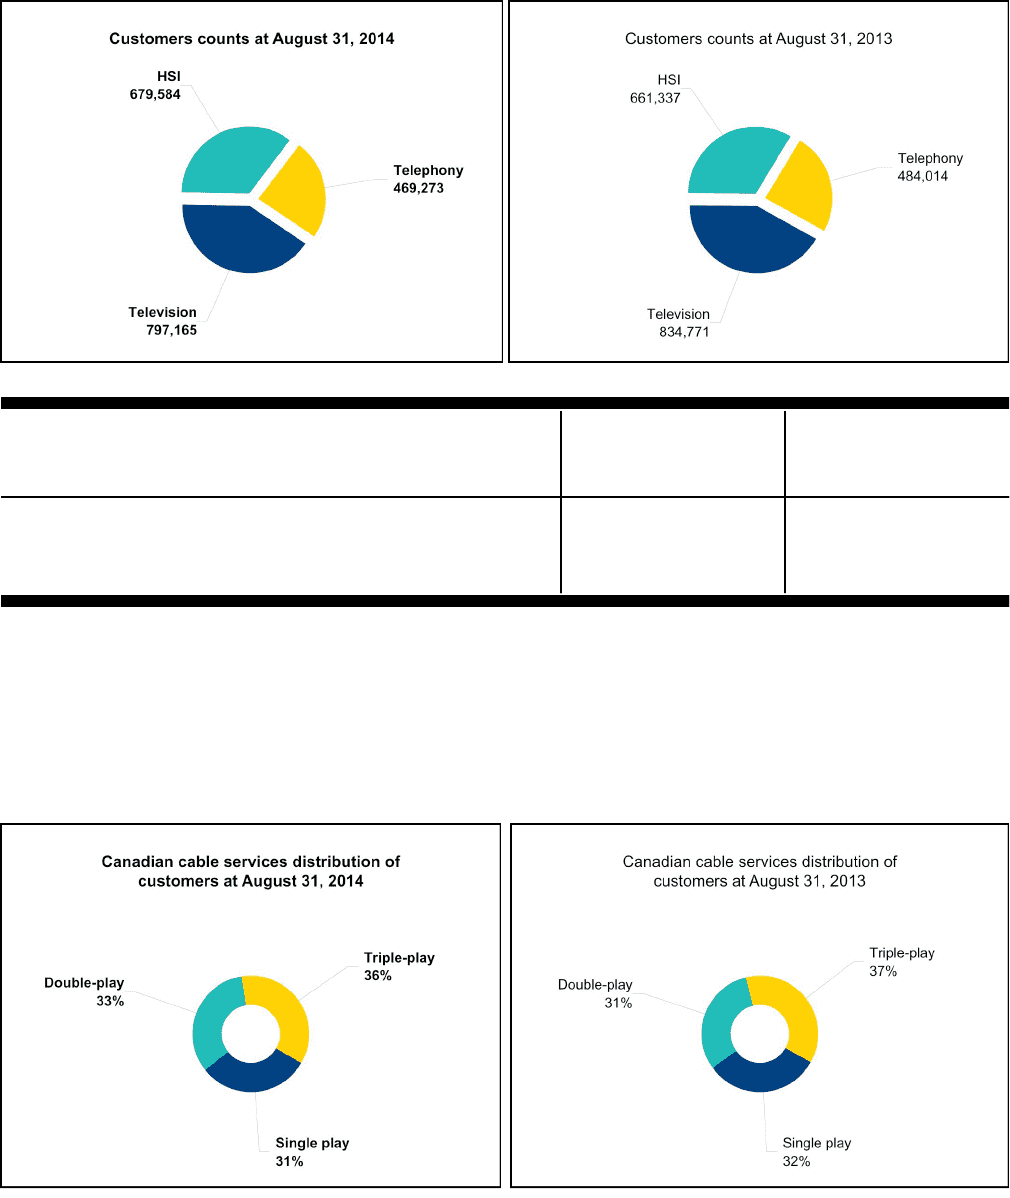
CANADIAN CABLE SERVICES
CUSTOMER STATISTICS
Net additions (losses) % of penetration(1)
Years ended
August 31,
2014 August 31,
2014 August 31,
2013 August 31,
2014 August 31,
2013
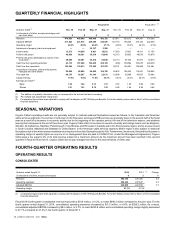
PSU 1,946,022 (34,100) 5,068
Television service customers 797,165 (37,606) (28,344) 47.3 49.9
HSI service customers 679,584 18,247 20,882 40.3 39.5
Telephony service customers 469,273 (14,741) 12,530 27.8 28.9
(1) As a percentage of homes passed.
Fiscal 2014 PSU net losses amounted to 34,100 compared to net additions of 5,068 for the prior year, mainly as a result of service category
maturity and competitive offers in the industry. Fiscal 2014 net customer losses for Television service stood at 37,606 compared to 28,344 for
the prior year. Television service customer net losses are mainly due to the promotional offers of competitors for the video service, service category
maturity and the IPTV footprint growth from competitors. Fiscal 2014 net additions for HSI service customers stood at 18,247 compared to 20,882
for the prior year. HSI net additions continue to stem from the enhancement of the product offering, the impact of the bundled offer of Television,
HSI and Telephony services, and promotional activities. Net losses for the Telephony service amounted to 14,741 compared to net additions of
12,530 for the prior year mainly attributable to the increasing mobile penetration rate in North America and various unlimited offers launched by
mobile operators causing customers to cancel their landline Telephony services for mobile telephony services only.