Cogeco 2014 Annual Report Download - page 83
Download and view the complete annual report
Please find page 83 of the 2014 Cogeco annual report below. You can navigate through the pages in the report by either clicking on the pages listed below, or by using the keyword search tool below to find specific information within the annual report.-
 1
1 -
2
-
3
-
4
-
5
-
6
-
7
-
8
-
9
-
10
-
11
-
12
-
13
-
14
-
15
-
16
-
17
-
18
-
19
-
20
-
21
-
22
-
23
-
24
-
25
-
26
-
27
-
28
-
29
-
30
-
31
-
32
-
33
-
34
-
35
-
36
-
37
-
38
-
39
-
40
-
41
-
42
-
43
-
44
-
45
-
46
-
47
-
48
-
49
-
50
-
51
-
52
-
53
-
54
-
55
-
56
-
57
-
58
-
59
-
60
-
61
-
62
-
63
-
64
-
65
-
66
-
67
-
68
-
69
-
70
-
71
-
72
-
 73
73 -
 74
74 -
 75
75 -
 76
76 -
 77
77 -
 78
78 -
 79
79 -
 80
80 -
 81
81 -
 82
82 -
 83
83 -
 84
84 -
 85
85 -
 86
86 -
 87
87 -
 88
88 -
 89
89 -
 90
90 -
 91
91 -
 92
92 -
 93
93 -
94
-
95
-
96
-
97
-
98
-
99
-
100
-
101
-
102
-
103
-
104
-
105
 |
 |

82 COGECO CABLE INC. 2014 Consolidated financial statements
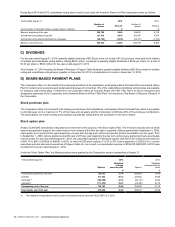
The following represents the key assumptions that were used to determine the recoverable amounts in the most recent impairment tests
performed for each of the Corporation operating segment:
At August 31, 2014 2013
Operating segment Pre-tax
discount rate
Perpetual
growth
rate Pre-tax
discount rate
Perpetual
growth
rate
% % % %
Canadian cable services 10.5 to 10.9 2.0 10.9 to 11.0 2.0
American cable services 12.1 to 13.0 2.5 to 3.0 13.0 3.0
Enterprise data services 11.7 3.5 to 3.8 11.8 to 12.0 4.3 to 4.8
The following table presents, for each operating segment, the change in the pre-tax discount rate and in the perpetual growth rate used for
the tests performed that would have been required in order for the recoverable amount to equal the carrying value of the CGU at August 31,
2014:
Operating segment Increase in
pre-tax discount rate Decrease in
perpetual growth rate
% %
Canadian cable services 4.1 to 5.5 3.9 to 5.8
American cable services 0.8 to 3.0 1.4 to 7.3
Enterprise data services 0.2 to 0.3 0.2 to 0.3
— —
15. PROVISIONS
During fiscal 2014, provisions variations were as follows:
Year ended August 31, 2014
Withholding
and
stamp taxes Programming
costs Other Total
(In thousands of Canadian dollars) $$$$
Balance at September 1, 2013 6,959 2,525 3,066 12,550
Provisions made during the year 185 5,023 2,630 7,838
Provisions used during the year — (1,261) (568)(1,829)
Provisions reversed during the year — (2,332) (273)(2,605)
Foreign currency translation adjustments — 28 5 33
Balance at August 31, 2014 7,144 3,983 4,860 15,987
The provisions for withholding and stamp taxes relate to contingent liabilities for withholding and stamp taxes relating to fiscal years prior
to the acquisition of a Portuguese subsidiary by the Corporation. Pursuant to the completion of the sale of the Portuguese subsidiary in
2012, the Corporation remains responsible for these contingent liabilities up to a maximum amount of €5 million under the terms of the sale
agreement.
The provisions for programming costs include provisions for rate increases as well as additional royalties or content costs as a result of
periodical audits from service providers.
The other provisions include provisions for contractual obligations and other legal obligations.