Health Net 2014 Annual Report Download - page 117
Download and view the complete annual report
Please find page 117 of the 2014 Health Net annual report below. You can navigate through the pages in the report by either clicking on the pages listed below, or by using the keyword search tool below to find specific information within the annual report.-
 1
1 -
2
-
3
-
4
-
5
-
6
-
7
-
8
-
9
-
10
-
11
-
12
-
13
-
14
-
15
-
16
-
17
-
18
-
19
-
20
-
21
-
22
-
23
-
24
-
25
-
26
-
27
-
28
-
29
-
30
-
31
-
32
-
33
-
34
-
35
-
36
-
37
-
38
-
39
-
40
-
41
-
42
-
43
-
44
-
45
-
46
-
47
-
48
-
49
-
50
-
51
-
52
-
53
-
54
-
55
-
56
-
57
-
58
-
59
-
60
-
61
-
62
-
63
-
64
-
65
-
66
-
67
-
68
-
69
-
70
-
71
-
72
-
73
-
74
-
75
-
76
-
77
-
78
-
79
-
80
-
81
-
82
-
83
-
84
-
85
-
86
-
87
-
88
-
89
-
90
-
91
-
92
-
93
-
94
-
95
-
96
-
97
-
98
-
99
-
100
-
101
-
102
-
103
-
104
-
105
-
106
-
 107
107 -
 108
108 -
 109
109 -
 110
110 -
 111
111 -
 112
112 -
 113
113 -
 114
114 -
 115
115 -
 116
116 -
 117
117 -
 118
118 -
 119
119 -
 120
120 -
 121
121 -
 122
122 -
 123
123 -
 124
124 -
 125
125 -
 126
126 -
 127
127 -
128
-
129
-
130
-
131
-
132
-
133
-
134
-
135
-
136
-
137
-
138
-
139
-
140
-
141
-
142
-
143
-
144
-
145
-
146
-
147
-
148
-
149
-
150
-
151
-
152
-
153
-
154
-
155
-
156
-
157
-
158
-
159
-
160
-
161
-
162
-
163
-
164
-
165
-
166
-
167
-
168
-
169
-
170
-
171
-
172
-
173
-
174
-
175
-
176
-
177
-
178
-
179
-
180
-
181
-
182
-
183
-
184
-
185
-
186
-
187
 |
 |

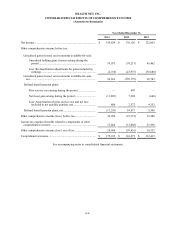
F-7
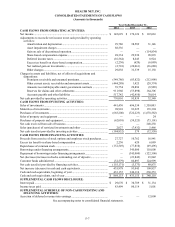
HEALTH NET, INC.
CONSOLIDATED STATEMENTS OF CASH FLOWS
(Amounts in thousands)
Year Ended December 31,
2014 2013 2012
CASH FLOWS FROM OPERATING ACTIVITIES:
Net income........................................................................................................ $ 145,629 $ 170,126 $ 122,063
Adjustments to reconcile net income to net cash provided by operating
activities:
Amortization and depreciation................................................................ 29,786 38,589 31,146
Asset impairment charges....................................................................... 88,536 — —
Gain on sale of discontinued operation................................................... — — (114,834)
Share-based compensation expense........................................................ 28,334 29,930 28,893
Deferred income taxes ............................................................................ (16,564) 8,645 8,924
Excess tax benefit on share-based compensation.................................... (2,230)(620)(6,089)
Net realized gain on investments ............................................................ (2,710)(24,061)(36,680)
Other changes.......................................................................................... 29,838 31,539 15,158
Changes in assets and liabilities, net of effects of acquisitions and
dispositions:
Premiums receivable and unearned premiums........................................ (549,786)(83,822)(212,998)
Other current assets, receivables and noncurrent assets.......................... (444,288) 1,425 (28,374)
Amounts receivable/payable under government contracts ..................... 39,754 20,896 (8,989)
Reserves for claims and other settlements.............................................. 911,960 (53,898) 164,306
Accounts payable and other liabilities .................................................... 517,742 (42,910) 70,014
Net cash provided by operating activities......................................................... 776,001 95,839 32,540
CASH FLOWS FROM INVESTING ACTIVITIES:
Sales of investments ......................................................................................... 441,430 696,534 1,350,003
Maturities of investments ................................................................................. 98,901 93,225 135,394
Purchases of investments.................................................................................. (665,200)(722,223)(1,678,582)
Sales of property and equipment ...................................................................... — — 24
Purchases of property and equipment............................................................... (62,010)(59,525)(73,101)
Net cash received from sale of business........................................................... — — 248,238
Sales (purchases) of restricted investments and other...................................... 2,027 (7,432) 5,466
Net cash (used in) provided by investing activities.......................................... (184,852) 579 (12,558)
CASH FLOWS FROM FINANCING ACTIVITIES:
Proceeds from exercise of stock options and employee stock purchases......... 27,727 10,762 16,941
Excess tax benefit on share-based compensation............................................. 2,230 620 6,089
Repurchases of common stock ......................................................................... (152,549)(77,810)(69,496)
Borrowings under financing arrangements....................................................... — 345,000 110,000
Repayment of borrowings under financing arrangements................................ — (345,000)(122,500)
Net (decrease) increase in checks outstanding, net of deposits........................ — (23,842) 23,842
Customer funds administered ........................................................................... (32,579) 86,897 124,999
Net cash (used in) provided by financing activities.......................................... (155,171)(3,373) 89,875
Net increase (decrease) in cash and cash equivalents....................................... 435,978 93,045 109,857
Cash and cash equivalents, beginning of year.................................................. 433,155 340,110 230,253
Cash and cash equivalents, end of year ............................................................ $ 869,133 $ 433,155 $ 340,110
SUPPLEMENTAL CASH FLOWS DISCLOSURE:
Interest paid ...................................................................................................... $ 29,670 $ 30,789 $ 31,134
Income taxes paid ............................................................................................. 83,499 80,119 5,001
SUPPLEMENTAL SCHEDULE OF NON-CASH INVESTING AND
FINANCING ACTIVITIES:
Accretion of deferred revenues into earnings................................................... — — 12,000
See accompanying notes to consolidated financial statements.