Health Net 2014 Annual Report Download - page 64
Download and view the complete annual report
Please find page 64 of the 2014 Health Net annual report below. You can navigate through the pages in the report by either clicking on the pages listed below, or by using the keyword search tool below to find specific information within the annual report.-
 1
1 -
2
-
3
-
4
-
5
-
6
-
7
-
8
-
9
-
10
-
11
-
12
-
13
-
14
-
15
-
16
-
17
-
18
-
19
-
20
-
21
-
22
-
23
-
24
-
25
-
26
-
27
-
28
-
29
-
30
-
31
-
32
-
33
-
34
-
35
-
36
-
37
-
38
-
39
-
40
-
41
-
42
-
43
-
44
-
45
-
46
-
47
-
48
-
49
-
50
-
51
-
52
-
53
-
 54
54 -
 55
55 -
 56
56 -
 57
57 -
 58
58 -
 59
59 -
 60
60 -
 61
61 -
 62
62 -
 63
63 -
 64
64 -
 65
65 -
 66
66 -
 67
67 -
 68
68 -
 69
69 -
 70
70 -
 71
71 -
 72
72 -
 73
73 -
 74
74 -
75
-
76
-
77
-
78
-
79
-
80
-
81
-
82
-
83
-
84
-
85
-
86
-
87
-
88
-
89
-
90
-
91
-
92
-
93
-
94
-
95
-
96
-
97
-
98
-
99
-
100
-
101
-
102
-
103
-
104
-
105
-
106
-
107
-
108
-
109
-
110
-
111
-
112
-
113
-
114
-
115
-
116
-
117
-
118
-
119
-
120
-
121
-
122
-
123
-
124
-
125
-
126
-
127
-
128
-
129
-
130
-
131
-
132
-
133
-
134
-
135
-
136
-
137
-
138
-
139
-
140
-
141
-
142
-
143
-
144
-
145
-
146
-
147
-
148
-
149
-
150
-
151
-
152
-
153
-
154
-
155
-
156
-
157
-
158
-
159
-
160
-
161
-
162
-
163
-
164
-
165
-
166
-
167
-
168
-
169
-
170
-
171
-
172
-
173
-
174
-
175
-
176
-
177
-
178
-
179
-
180
-
181
-
182
-
183
-
184
-
185
-
186
-
187
 |
 |

62
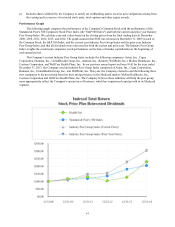
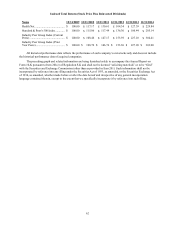
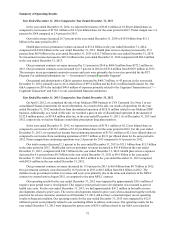
Indexed Total Return (Stock Price Plus Reinvested Dividends)
Name 12/31/2009 12/31/2010 12/31/2011 12/31/2012 12/31/2013 12/31/2014
Health Net.......................................... $ 100.00 $117.17 $130.61 $104.34 $127.39 $229.84
Standard & Poor's 500 Index............. $ 100.00 $115.06 $117.49 $136.30 $180.44 $205.14
Industry Peer Group Index (Current
Peers)................................................. $ 100.00 $108.46 $147.17 $153.59 $227.10 $304.41
Industry Peer Group Index (Prior
Year Peers)......................................... $ 100.00 $ 108.70 $ 146.76 $ 153.30 $ 227.20 $ 303.00
All historical performance data reflects the performance of each company’s own stocks only and does not include
the historical performance data of acquired companies.
The preceding graph and related information are being furnished solely to accompany this Annual Report on
Form 10-K pursuant to Item 201(e) of Regulation S-K and shall not be deemed “soliciting materials” or to be “filed”
with the Securities and Exchange Commission (other than as provided in Item 201). Such information shall not be
incorporated by reference into any filing under the Securities Act of 1933, as amended, or the Securities Exchange Act
of 1934, as amended, whether made before or after the date hereof and irrespective of any general incorporation
language contained therein, except to the extent that we specifically incorporate it by reference into such filing.