Health Net 2014 Annual Report Download - page 171
Download and view the complete annual report
Please find page 171 of the 2014 Health Net annual report below. You can navigate through the pages in the report by either clicking on the pages listed below, or by using the keyword search tool below to find specific information within the annual report.-
 1
1 -
2
-
3
-
4
-
5
-
6
-
7
-
8
-
9
-
10
-
11
-
12
-
13
-
14
-
15
-
16
-
17
-
18
-
19
-
20
-
21
-
22
-
23
-
24
-
25
-
26
-
27
-
28
-
29
-
30
-
31
-
32
-
33
-
34
-
35
-
36
-
37
-
38
-
39
-
40
-
41
-
42
-
43
-
44
-
45
-
46
-
47
-
48
-
49
-
50
-
51
-
52
-
53
-
54
-
55
-
56
-
57
-
58
-
59
-
60
-
61
-
62
-
63
-
64
-
65
-
66
-
67
-
68
-
69
-
70
-
71
-
72
-
73
-
74
-
75
-
76
-
77
-
78
-
79
-
80
-
81
-
82
-
83
-
84
-
85
-
86
-
87
-
88
-
89
-
90
-
91
-
92
-
93
-
94
-
95
-
96
-
97
-
98
-
99
-
100
-
101
-
102
-
103
-
104
-
105
-
106
-
107
-
108
-
109
-
110
-
111
-
112
-
113
-
114
-
115
-
116
-
117
-
118
-
119
-
120
-
121
-
122
-
123
-
124
-
125
-
126
-
127
-
128
-
129
-
130
-
131
-
132
-
133
-
134
-
135
-
136
-
137
-
138
-
139
-
140
-
141
-
142
-
143
-
144
-
145
-
146
-
147
-
148
-
149
-
150
-
151
-
152
-
153
-
154
-
155
-
156
-
157
-
158
-
159
-
160
-
 161
161 -
 162
162 -
 163
163 -
 164
164 -
 165
165 -
 166
166 -
 167
167 -
 168
168 -
 169
169 -
 170
170 -
 171
171 -
 172
172 -
 173
173 -
 174
174 -
 175
175 -
 176
176 -
 177
177 -
 178
178 -
 179
179 -
 180
180 -
 181
181 -
182
-
183
-
184
-
185
-
186
-
187
 |
 |

HEALTH NET, INC.
NOTES TO CONSOLIDATED FINANCIAL STATEMENTS—(Continued)
F-61
$53.4 million and $53.4 million as of December 31, 2014, 2013 and 2012, respectively; the increase in the
provision for adverse deviation from December 31, 2013 to December 31, 2014 was primarily driven by growth
in our new products offered or programs administered under the ACA.
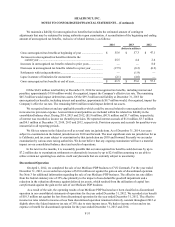
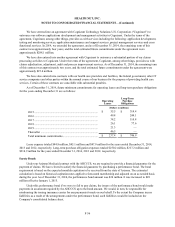
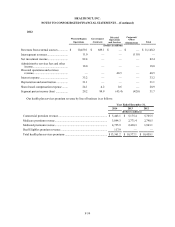
The following table shows the Company’s health plan services expenses for the years ended December 31:
Health Plan Services
2014 2013 2012
(Dollars in millions)
Total incurred fee for service claims .................................................... $5,598.4 $4,609.8 $4,985.4
Capitated expenses and shared risk ...................................................... 4,256.8 3,108.0 3,128.1
Pharmacy and other .............................................................................. 1,452.6 1,168.7 1,202.8
Health plan services.............................................................................. $11,307.8 $8,886.5 $9,316.3
For the years ended December 31, 2014, 2013 and 2012, the Company’s capitated, shared risk, pharmacy and
other expenses represented 50%, 48% and 46%, respectively, of the Company’s total health plan services.
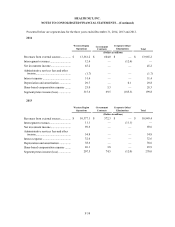
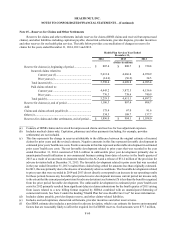
Note 16—Quarterly Information (Unaudited)
The following interim financial information presents the 2014 and 2013 results of operations on a quarterly basis:
2014
March 31 June 30 September 30 December 31
(Dollars in millions, except per share data)
Total revenues..................................... $ 3,038.9 $ 3,421.4 $ 3,789.9 $ 3,758.4
Health plan services costs ................... 2,402.3 2,763.2 3,104.0 3,038.2
Government contracts costs ................ 132.0 133.2 124.4 147.1
Income from continuing operations
before income taxes ............................ 62.0 (1) 98.8 (2) 22.7 (4) (5) 16.3 (6) (7)
Net income (loss) ................................ 28.8 (1) 120.9 (2) (3) (8.9)(4) (5) 4.9 (6) (7)
Basic earnings (loss) per share $ 0.36 $ 1.51 $ (0.11) $ 0.06
Diluted earnings (loss) per share (8) $ 0.36 $ 1.49 $ (0.11) $ 0.06
__________
(1) Includes $36.3 million amortization of deferred costs of health insurer's fee and $22.5 million in other ACA fees.
(2) Includes $37.8 million amortization of deferred costs of health insurer's fee and $22.5 million in other ACA fees.
(3) Includes tax benefit of $72.6 million, net of adjustments, as a result of a loss on the stock of one of our
subsidiaries.
(4) Includes $84.7 million pretax asset impairment related to our assets held for sale in connection with the Cognizant
Transaction and $21.1 million in pretax expenses primarily related to the Cognizant transaction.
(5) Includes $31.9 million amortization of deferred costs of health insurer's fee and $26.6 million in other ACA fees.
(6) Includes $3.8 million pretax asset impairment primarily related to our assets held for sale in connection with the
Cognizant Transaction and $68.3 million in pretax expenses primarily related to the Cognizant Transaction.
(7) Includes $35.4 million amortization of deferred costs of health insurer's fee and $25.8 million in other ACA fees.
(8) The sum of the quarterly amounts may not equal the year-to-date amounts due to rounding.