Health Net 2014 Annual Report Download - page 127
Download and view the complete annual report
Please find page 127 of the 2014 Health Net annual report below. You can navigate through the pages in the report by either clicking on the pages listed below, or by using the keyword search tool below to find specific information within the annual report.-
 1
1 -
2
-
3
-
4
-
5
-
6
-
7
-
8
-
9
-
10
-
11
-
12
-
13
-
14
-
15
-
16
-
17
-
18
-
19
-
20
-
21
-
22
-
23
-
24
-
25
-
26
-
27
-
28
-
29
-
30
-
31
-
32
-
33
-
34
-
35
-
36
-
37
-
38
-
39
-
40
-
41
-
42
-
43
-
44
-
45
-
46
-
47
-
48
-
49
-
50
-
51
-
52
-
53
-
54
-
55
-
56
-
57
-
58
-
59
-
60
-
61
-
62
-
63
-
64
-
65
-
66
-
67
-
68
-
69
-
70
-
71
-
72
-
73
-
74
-
75
-
76
-
77
-
78
-
79
-
80
-
81
-
82
-
83
-
84
-
85
-
86
-
87
-
88
-
89
-
90
-
91
-
92
-
93
-
94
-
95
-
96
-
97
-
98
-
99
-
100
-
101
-
102
-
103
-
104
-
105
-
106
-
107
-
108
-
109
-
110
-
111
-
112
-
113
-
114
-
115
-
116
-
 117
117 -
 118
118 -
 119
119 -
 120
120 -
 121
121 -
 122
122 -
 123
123 -
 124
124 -
 125
125 -
 126
126 -
 127
127 -
 128
128 -
 129
129 -
 130
130 -
 131
131 -
 132
132 -
 133
133 -
 134
134 -
 135
135 -
 136
136 -
 137
137 -
138
-
139
-
140
-
141
-
142
-
143
-
144
-
145
-
146
-
147
-
148
-
149
-
150
-
151
-
152
-
153
-
154
-
155
-
156
-
157
-
158
-
159
-
160
-
161
-
162
-
163
-
164
-
165
-
166
-
167
-
168
-
169
-
170
-
171
-
172
-
173
-
174
-
175
-
176
-
177
-
178
-
179
-
180
-
181
-
182
-
183
-
184
-
185
-
186
-
187
 |
 |
HEALTH NET, INC.
NOTES TO CONSOLIDATED FINANCIAL STATEMENTS—(Continued)
F-17
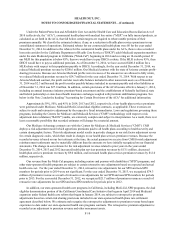
value of such financial instruments. The fair value of notes payable is estimated based on the quoted market prices for
the same or similar issues or on the current rates offered to us for debt with the same remaining maturities. The fair
value of our fixed-rate borrowings was $437.0 million and $434.5 million as of December 31, 2014 and 2013,
respectively. The fair value of our variable-rate borrowings under our revolving credit facility was $100.0 million and
$100.0 million as of December 31, 2014 and 2013, respectively, which was equal to the carrying value because the
interest rates paid on these borrowings were based on prevailing market rates. The fair value of our fixed-rate
borrowings was determined using the quoted market price, which is a Level 1 input in the fair value hierarchy. The fair
value of our variable-rate borrowings was estimated to equal the carrying value because the interest rates paid on these
borrowings were based on prevailing market rates. Since the pricing inputs are other than quoted prices and fair value is
determined using an income approach, our variable-rate borrowings are classified as a Level 2 in the fair value
hierarchy. See Notes 6 and 7 for additional information regarding our financing arrangements and fair value
measurements, respectively.
Restricted Assets
We and our consolidated subsidiaries are required to set aside certain funds which may only be used for certain
purposes pursuant to state regulatory requirements. We have discretion as to whether we invest such funds in cash and
cash equivalents or other investments. As of December 31, 2014 and 2013, the restricted cash and cash equivalents
balances totaled $0.2 million and $5.3 million, respectively, and are included in other noncurrent assets. Investment
securities held by trustees or agencies were $24.0 million and $23.8 million as of December 31, 2014 and 2013,
respectively, and are included in investments available-for-sale. For additional information on our regulatory
requirements, see Note 12.
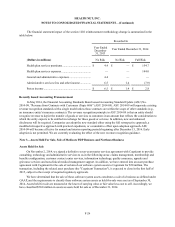
Property and Equipment
Property and equipment are stated at historical cost less accumulated depreciation. Depreciation is computed
using the straight-line method over the lesser of estimated useful lives of the various classes of assets or the remaining
lease term, in the case of leasehold improvements. The useful life for buildings and improvements is estimated at 35 to
40 years, and the useful lives for furniture, equipment and software range from 3 to 10 years (see Note 5).
We capitalize certain consulting costs, payroll and payroll-related costs for employees associated with computer
software developed for internal use. We amortize such costs primarily over a five-year period. Expenditures for
maintenance and repairs are expensed as incurred. Major improvements, which increase the estimated useful life of an
asset, are capitalized. Upon the sale or retirement of assets, the recorded cost and the related accumulated depreciation
are removed from the accounts, and any gain or loss on disposal is reflected in operations.
Wee periodically assess long-lived assets or asset groups including property and equipment for recoverability
when events or changes in circumstances indicate that their carrying amount may not be recoverable. If we identify an
indicator of impairment, we assess recoverability by comparing the carrying amount of the asset to the sum of the
undiscounted cash flows expected to result from the use and the eventual disposal of the asset. An impairment loss is
recognized when the carrying amount is not recoverable and is measured as the excess of carrying value over fair value.
Long-lived assets are classified as held for sale and included as part of current assets when certain criteria are met. We
measure long-lived assets to be disposed of by sale at the lower of carrying amount or fair value less cost to sell. Fair
value is determined using quoted market prices or the anticipated cash flows discounted at a rate commensurate with
the risk involved.
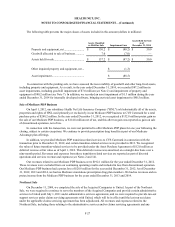
In connection with the Cognizant Transaction, we classified certain software systems assets as held-for-sale. As
of December 31, 2014, we had classified software systems assets with a total net book value of $130.2 million as assets
held for sale. We assessed the recoverability of these assets held for sale and as a result, we recorded $80.2 million in
asset impairments during the year ended December 31, 2014. See Note 3 for more information regarding assets held for
sale and the Cognizant Transaction. In addition, we recorded an asset impairment of $1.3 million during the year ended
December 31, 2014 for internally developed software.
During the years ended December 31, 2013 and 2012, we recorded $1.2 million and $0.5 million respectively, in
impairment losses to general and administrative expenses primarily for internally developed software.