LeapFrog 2002 Annual Report Download - page 32
Download and view the complete annual report
Please find page 32 of the 2002 LeapFrog annual report below. You can navigate through the pages in the report by either clicking on the pages listed below, or by using the keyword search tool below to find specific information within the annual report.-
 1
1 -
2
-
3
-
4
-
5
-
6
-
7
-
8
-
9
-
10
-
11
-
12
-
13
-
14
-
15
-
16
-
17
-
18
-
19
-
20
-
21
-
 22
22 -
 23
23 -
 24
24 -
 25
25 -
 26
26 -
 27
27 -
 28
28 -
 29
29 -
 30
30 -
 31
31 -
 32
32 -
 33
33 -
 34
34 -
 35
35 -
 36
36 -
 37
37 -
 38
38 -
 39
39 -
 40
40 -
 41
41 -
 42
42 -
43
-
44
-
45
-
46
-
47
-
48
-
49
-
50
-
51
-
52
-
53
-
54
-
55
-
56
-
57
-
58
-
59
-
60
-
61
-
62
-
63
-
64
-
65
-
66
-
67
-
68
-
69
-
70
-
71
-
72
-
73
-
74
-
75
-
76
-
77
-
78
-
79
-
80
-
81
-
82
-
83
-
84
-
85
-
86
-
87
-
88
-
89
-
90
-
91
-
92
-
93
-
94
-
95
-
96
-
97
-
98
-
99
-
100
-
101
-
102
-
103
-
104
 |
 |
Item 7. Management’s Discussion and Analysis of Financial Condition and Results of Operation.
Overview
We design, develop and market technology-based educational platforms, related interactive content and
stand-alone products for sale to retailers, distributors and schools. Since the founding of our business in 1995, we
have grown from a start-up business selling stand-alone educational toys into a company selling multiple
platform products and related interactive content, as well as stand-alone products, with total net sales in 2002 of
$531.8 million. Our business was started in 1995 by LeapFrog RBT, LLC, which was founded by Michael C.
Wood, our Chief Executive Officer and President. In 1997, substantially all the assets and business of LeapFrog
RBT were acquired by Knowledge Kids Enterprises, Inc., an affiliate of Knowledge Universe that had no
operations prior to that time. In 1998, we acquired the assets of Explore Technologies, Inc., which included the
proprietary NearTouch technology that is central to many of our products. In February 2001, we changed our
name to LeapFrog Enterprises, Inc.
We operate three business segments, which we refer to as U.S. Consumer, Education and Training and
International. In the U.S. Consumer segment, we market and sell our products directly to national and regional
mass-market and specialty retailers as well as to other retail stores through sales representatives. Our Education
and Training segment targets the school market in the United States, including sales directly to educational
institutions, to teacher supply stores and through catalogs aimed at educators. In our International segment, we
sell our products outside the United States directly to overseas retailers and through various distribution and
strategic arrangements. To date, we have sold our products predominantly through the toy sections of major
retailers. For further information regarding our three business segments, see Note 22 to our consolidated financial
statements contained elsewhere in this annual report.
Our U.S. Consumer segment is our most developed business, and is subject to significant seasonal
influences, with the substantial majority of our sales occurring in the third and fourth quarters. In 2002, this
segment represented approximately 86% of our total net sales. Although we are expanding our retail presence by
selling our products to bookstores and electronics and office supply stores, the significant majority of our U.S.
Consumer sales are to a few large retailers. Sales to Wal-Mart (including Sam’s Club), Toys “R” Us and Target
accounted for approximately 69% of our total net sales in 2002 compared to 68% in 2001. At December 31,
2002, Wal-Mart (including Sam’s Club), Toys “R” Us and Target accounted for 33%, 30% and 14%,
respectively, of our accounts receivable. In 2002, as part of our U.S. Consumer marketing strategy, we rolled out
LeapFrog Learning Center display units in a select number of our national and regional mass-market accounts,
allowing us to showcase our family of platforms, related software and stand-alone learning tools in one dedicated
area. In 2003 we will complement these display units with new Learning Center navigational signage and new
product layouts to help guide shoppers to the appropriate products. Consistent with industry practice, we rely on
short-term purchase orders for the sale of our products to retailers. Although we believe net sales for this
business segment will grow in the future, we anticipate that this segment’s percentage in net sales will decrease,
as our other two segments grow.
We launched our Education and Training and International businesses in 1999 and 2000, respectively, and
began accounting for these businesses as separate segments in 2000.
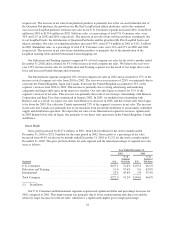
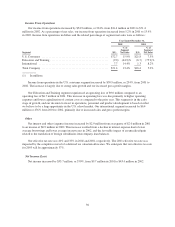
The Education and Training and International segments represented approximately 4% and 10%,
respectively, of our total net sales in 2002. We expect net sales from these segments to grow and, in aggregate, to
comprise a larger percentage of our total net sales in the future. Net sales in our Education and Training segment
increased by 129% from 2001 to 2002, however the segment incurred operating losses of $6.7 million in 2001
and $9.0 million in 2002.
Net sales in our international segment increased 228% from 2001 to 2002. As a result, operating income for
the International segment grew from $1.3 million in 2001 to $7.7 million in 2002.
We expect that our gross profit margins in the U.S. Consumer segment will increase slightly due to a
continued trend toward higher-margin content sales and lower manufacturing costs. We anticipate that our
27