LeapFrog 2002 Annual Report Download - page 45
Download and view the complete annual report
Please find page 45 of the 2002 LeapFrog annual report below. You can navigate through the pages in the report by either clicking on the pages listed below, or by using the keyword search tool below to find specific information within the annual report.-
 1
1 -
2
-
3
-
4
-
5
-
6
-
7
-
8
-
9
-
10
-
11
-
12
-
13
-
14
-
15
-
16
-
17
-
18
-
19
-
20
-
21
-
22
-
23
-
24
-
25
-
26
-
27
-
28
-
29
-
30
-
31
-
32
-
33
-
34
-
 35
35 -
 36
36 -
 37
37 -
 38
38 -
 39
39 -
 40
40 -
 41
41 -
 42
42 -
 43
43 -
 44
44 -
 45
45 -
 46
46 -
 47
47 -
 48
48 -
 49
49 -
 50
50 -
 51
51 -
 52
52 -
 53
53 -
 54
54 -
 55
55 -
56
-
57
-
58
-
59
-
60
-
61
-
62
-
63
-
64
-
65
-
66
-
67
-
68
-
69
-
70
-
71
-
72
-
73
-
74
-
75
-
76
-
77
-
78
-
79
-
80
-
81
-
82
-
83
-
84
-
85
-
86
-
87
-
88
-
89
-
90
-
91
-
92
-
93
-
94
-
95
-
96
-
97
-
98
-
99
-
100
-
101
-
102
-
103
-
104
 |
 |

our total property and equipment relating to our growth. Through 2001, virtually all depreciation and
amortization expense related to our U.S. Consumer segment. This content capitalized for our Education and
Training segment had not yet been placed into service by December 31, 2001, and the related depreciation had
not commenced.
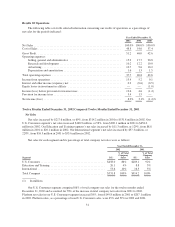
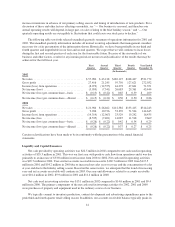
Income (Loss) From Operations
Income from operations increased by $16.3 million from $0.1 million in 2000 to $16.4 million in 2001.
Income (loss) from operations in dollars for each segment and the related percentage of segment net sales were as
follows:
Year Ended December 31,
2001 2000
Segment $(1)
%of
Segment
Net Sales $(1)
%of
Segment
Net Sales
U.S.Consumer................................................ $21.8 7.5% $ 1.3 0.9%
Education and Training ......................................... (6.7) (75.9)% (3.2) (72.8)%
International .................................................. 1.3 8.2% 2.0 22.6%
TotalCompany ............................................... $16.4 5.2% $ 0.1 0.1%
(1) In millions.
Our U.S. Consumer segment experienced substantial growth in operating income from $1.3 million in 2000
to $21.8 million in 2001, due to strong sales growth, increased grow profit margins and favorable expense
leverage. Our Education and Training segment experienced an increased operating loss due primarily to
increased operating expenses. This segment is in the early stage of growth and our decision to invest in human
infrastructure and products is based on what we believe to be a large opportunity in the U.S. school market. Our
International segment’s operating profit was lower in 2001 due to building out the U.K. direct sales channel.
Other
Net interest expense increased by $1.8 million, from $0.4 million in 2000 to $2.3 million in 2001. The
increase related to higher average borrowings on our long-term credit facility, partially offset by lower average
interest rates in 2001 than in 2000.
Our effective tax rate was 33% in 2001 as compared to a zero tax rate in 2000, when we had a net loss
before income taxes. The effective tax rate was impacted by the reversal of the deferred tax valuation allowance
and by our achieving pre-tax earnings.
Net Income (Loss)
In 2000, we incurred a net loss of $2.3 million, or 1.4% of net sales. In 2001, we achieved net income of
$9.7 million, or 3.1% of net sales.
Seasonality and Quarterly Results Of Operations
Our business is subject to significant seasonal fluctuations. The substantial majority of our net sales and all
of our net income are realized during the third and fourth calendar quarters. In addition, our quarterly results of
operations have fluctuated significantly in the past, and can be expected to continue to fluctuate significantly in
the future, as a result of many factors, including: seasonal influences on our sales, such as the holiday shopping
season and back-to-school purchasing; unpredictable consumer preferences and spending trends; the need to
40