LeapFrog 2002 Annual Report Download - page 44
Download and view the complete annual report
Please find page 44 of the 2002 LeapFrog annual report below. You can navigate through the pages in the report by either clicking on the pages listed below, or by using the keyword search tool below to find specific information within the annual report.-
 1
1 -
2
-
3
-
4
-
5
-
6
-
7
-
8
-
9
-
10
-
11
-
12
-
13
-
14
-
15
-
16
-
17
-
18
-
19
-
20
-
21
-
22
-
23
-
24
-
25
-
26
-
27
-
28
-
29
-
30
-
31
-
32
-
33
-
 34
34 -
 35
35 -
 36
36 -
 37
37 -
 38
38 -
 39
39 -
 40
40 -
 41
41 -
 42
42 -
 43
43 -
 44
44 -
 45
45 -
 46
46 -
 47
47 -
 48
48 -
 49
49 -
 50
50 -
 51
51 -
 52
52 -
 53
53 -
 54
54 -
55
-
56
-
57
-
58
-
59
-
60
-
61
-
62
-
63
-
64
-
65
-
66
-
67
-
68
-
69
-
70
-
71
-
72
-
73
-
74
-
75
-
76
-
77
-
78
-
79
-
80
-
81
-
82
-
83
-
84
-
85
-
86
-
87
-
88
-
89
-
90
-
91
-
92
-
93
-
94
-
95
-
96
-
97
-
98
-
99
-
100
-
101
-
102
-
103
-
104
 |
 |

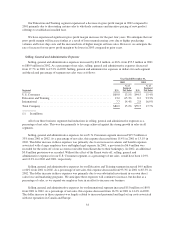
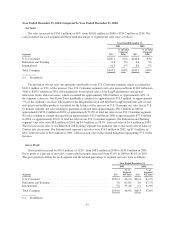
related to the development of an increased number of interactive books, activity sheets, chapter outlines and test
questions for our existing LeapPad and Turbo Twist platforms, as well as for our newly developed Imagination
Desk and iQuest platforms. In 2000, we only developed interactive books for our LeapPad platform and other
content for our Turbo Twist platform. Our product development and engineering expenses increased by $10.9
million, or 87.8%, from $12.5 million, or 7.8% of net sales in 2000, to $23.4 million, or 7.5% of net sales in
2001. The reduction in the percentage of net sales represented by these expenses resulted primarily from
increased leverage of our technology group based in Los Gatos, California achieved against strong sales growth.
This group performs all hardware and software engineering and all ASIC design for our products. Included in
research and development expense in 2001 is $1.9 million of research expense related to the funding of Ubiquity
LLC. This indirect, wholly owned subsidiary was formed to explore magazine publishing applications of our
NearTouch technology. In February 2001, we decided to cease those operations to focus on our core business.
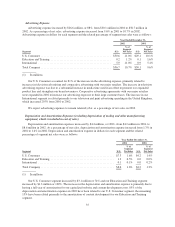
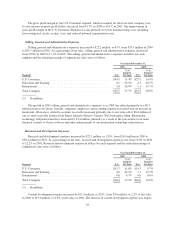
Advertising Expense
Advertising expense increased by $13.8 million, or 84%, from $16.4 million in 2000 to $30.1 million in
2001, with 98% of this increase being attributable to our U.S. Consumer segment. As a percentage of net sales,
advertising expense was 9.6% in 2001, compared to 10.2% in 2000. Increased television and print advertising
accounted for 68% of the total dollar increase. The balance of the advertising increase is due to increased
spending on cooperative, or co-op, advertising and increased displays expense. Advertising expense in dollars for
each segment and the related percentage of segment net sales were as follows:
Year Ended December 31,
2001 2000
Segment $(1)
%of
Segment
Net Sales $(1)
%of
Segment
Net Sales
U.S.Consumer ................................................. $29.1 10.1% $15.6 10.6%
Education and Training .......................................... 0.1 1.6% 0.1 2.3%
International ................................................... 0.9 5.4% 0.6 7.2%
TotalCompany................................................. $30.1 9.6% $16.4 10.2%
(1) In millions.
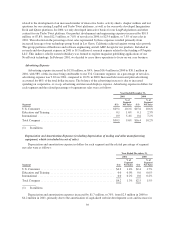
Depreciation and Amortization Expenses (excluding depreciation of tooling and other manufacturing
equipment, which is included in cost of sales)
Depreciation and amortization expense in dollars for each segment and the related percentage of segment
net sales were as follows:
Year Ended December 31,
2001 2000
Segment $(1)
%of
Segment
Net Sales $(1)
%of
Segment
Net Sales
U.S.Consumer ................................................... $4.2 1.4% $2.4 1.7%
Education and Training ............................................ 0.0 0.0% 0.0 0.0%
International ..................................................... 0.0 0.2% 0.0 0.2%
TotalCompany................................................... $4.2 1.3% $2.5 1.5%
(1) In millions.
Depreciation and amortization expenses increased by $1.7 million, or 70%, from $2.5 million in 2000 to
$4.2 million in 2001, primarily due to the amortization of capitalized website development costs and increases in
39