LeapFrog 2002 Annual Report Download - page 97
Download and view the complete annual report
Please find page 97 of the 2002 LeapFrog annual report below. You can navigate through the pages in the report by either clicking on the pages listed below, or by using the keyword search tool below to find specific information within the annual report.-
 1
1 -
2
-
3
-
4
-
5
-
6
-
7
-
8
-
9
-
10
-
11
-
12
-
13
-
14
-
15
-
16
-
17
-
18
-
19
-
20
-
21
-
22
-
23
-
24
-
25
-
26
-
27
-
28
-
29
-
30
-
31
-
32
-
33
-
34
-
35
-
36
-
37
-
38
-
39
-
40
-
41
-
42
-
43
-
44
-
45
-
46
-
47
-
48
-
49
-
50
-
51
-
52
-
53
-
54
-
55
-
56
-
57
-
58
-
59
-
60
-
61
-
62
-
63
-
64
-
65
-
66
-
67
-
68
-
69
-
70
-
71
-
72
-
73
-
74
-
75
-
76
-
77
-
78
-
79
-
80
-
81
-
82
-
83
-
84
-
85
-
86
-
 87
87 -
 88
88 -
 89
89 -
 90
90 -
 91
91 -
 92
92 -
 93
93 -
 94
94 -
 95
95 -
 96
96 -
 97
97 -
 98
98 -
 99
99 -
 100
100 -
 101
101 -
 102
102 -
 103
103 -
 104
104
 |
 |

LEAPFROG ENTERPRISES, INC.
NOTES TO CONSOLIDATED FINANCIAL STATEMENTS—(Continued)
(In thousands, except share, per share and percent data)
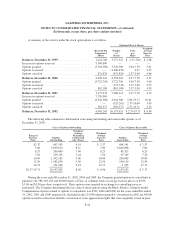
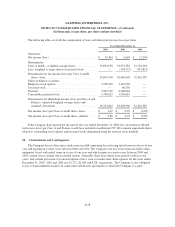
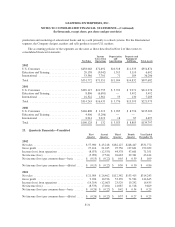
The following table sets forth the computation of basic and diluted net income (loss) per share.
Year Ended December 31,
2002 2001 2000
Numerator:
Netincome(loss) ................................ $ 43,444 $ 9,669 $ (2,259)
Denominator:
Class A and B—weighted average shares .............. 39,694,538 33,553,784 32,794,238
Less: weighted average shares of unvested stock ........ — (104,775) (331,851)
Denominator for net income (loss) per Class A and B
share—basic .................................. 39,694,538 33,449,009 32,462,387
Effect of dilutive securities:
Employeestockoptions ........................... 3,358,782 1,143,904 —
Unvested stock .................................. — 66,336 —
Warrants ....................................... 5,909,700 2,260,062 —
Convertible preferred stock ......................... 1,780,822 1,550,685 —
Denominator for diluted net income (loss) per Class A and
B share—adjusted weighted average shares and
assumed conversions ............................ 50,743,842 38,469,996 32,462,387
Net income (loss) per Class A and B share—basic ....... $ 1.09 $ 0.29 $ (0.07)
Net income (loss) per Class A and B share—diluted ..... $ 0.86 $ 0.25 $ (0.07)
If the Company had reported net income for the year ended December 31, 2000, the calculation of diluted
net income (loss) per Class A and B share would have included an additional 797,340 common equivalent shares
related to outstanding stock options and unvested stock (determined using the treasury stock method).
20. Commitments and Contingencies
The Company leases office space under noncancelable operating leases having initial terms in excess of one
year and expiring in various years between 2004 and 2010. The Company also has several noncancelable office
equipment leases with initial terms in excess of one year and which expire in various years between 2000 and
2004, certain leases contain rent escalation clauses. Generally, these have initial lease periods of three to ten
years, and contain provisions for renewal options of five years at market rates. Rent expense for the years ended
December 31, 2002, 2001 and 2000 was $2,772, $2,083 and $728, respectively. The Company is also obligated
to pay certain minimum royalties in connection with license agreements to which the Company is a party.
F-28