Pepsi 2015 Annual Report Download - page 105
Download and view the complete annual report
Please find page 105 of the 2015 Pepsi annual report below. You can navigate through the pages in the report by either clicking on the pages listed below, or by using the keyword search tool below to find specific information within the annual report.-
 1
1 -
2
-
3
-
4
-
5
-
6
-
7
-
8
-
9
-
10
-
11
-
12
-
13
-
14
-
15
-
16
-
17
-
18
-
19
-
20
-
21
-
22
-
23
-
24
-
25
-
26
-
27
-
28
-
29
-
30
-
31
-
32
-
33
-
34
-
35
-
36
-
37
-
38
-
39
-
40
-
41
-
42
-
43
-
44
-
45
-
46
-
47
-
48
-
49
-
50
-
51
-
52
-
53
-
54
-
55
-
56
-
57
-
58
-
59
-
60
-
61
-
62
-
63
-
64
-
65
-
66
-
67
-
68
-
69
-
70
-
71
-
72
-
73
-
74
-
75
-
76
-
77
-
78
-
79
-
80
-
81
-
82
-
83
-
84
-
85
-
86
-
87
-
88
-
89
-
90
-
91
-
92
-
93
-
94
-
 95
95 -
 96
96 -
 97
97 -
 98
98 -
 99
99 -
 100
100 -
 101
101 -
 102
102 -
 103
103 -
 104
104 -
 105
105 -
 106
106 -
 107
107 -
 108
108 -
 109
109 -
 110
110 -
 111
111 -
 112
112 -
 113
113 -
 114
114 -
 115
115 -
116
-
117
-
118
-
119
-
120
-
121
-
122
-
123
-
124
-
125
-
126
-
127
-
128
-
129
-
130
-
131
-
132
-
133
-
134
-
135
-
136
-
137
-
138
-
139
-
140
-
141
-
142
-
143
-
144
-
145
-
146
-
147
-
148
-
149
-
150
-
151
-
152
-
153
-
154
-
155
-
156
-
157
-
158
-
159
-
160
-
161
-
162
-
163
-
164
-
165
-
166
-
167
-
168
 |
 |

Table of Contents
88
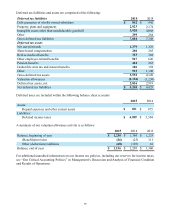
In 2015, the FASB issued guidance that requires companies to classify all deferred tax assets and liabilities
as noncurrent on the balance sheet. The standard is effective in 2017 with early adoption permitted. The
guidance is not expected to have a material impact on our balance sheet. We are evaluating the timing for
adoption of this guidance.
In 2015, the FASB issued guidance that requires entities to measure inventory at the lower of cost or net
realizable value. The guidance is effective in 2017 with early adoption permitted. The guidance is not expected
to have a material impact on our financial statements. We are evaluating the timing for adoption of this
guidance.
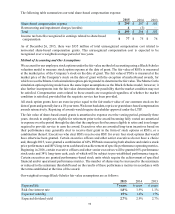
In 2014, the FASB issued guidance on revenue recognition, which provides for a single five-step model to
be applied to all revenue contracts with customers. The new standard also requires additional financial
statement disclosures that will enable users to understand the nature, amount, timing and uncertainty of
revenue and cash flows relating to customer contracts. We have an option to use either a retrospective approach
or a cumulative effect adjustment approach to implement the guidance. In 2015, the FASB issued a deferral
of the effective date of the guidance to 2018, with early adoption permitted in 2017. We are currently evaluating
the impact of this guidance on our financial statements and have not yet selected a transition approach.
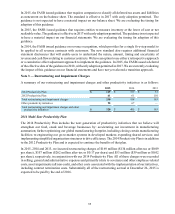
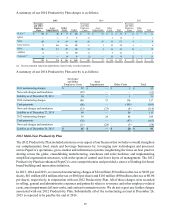
Note 3 — Restructuring and Impairment Charges
A summary of our restructuring and impairment charges and other productivity initiatives is as follows:
2015 2014 2013
2014 Productivity Plan $ 169 $ 357 $ 53
2012 Productivity Plan 61 61 110
Total restructuring and impairment charges 230 418 163
Other productivity initiatives 90 67 —
Total restructuring and impairment charges and other
productivity initiatives $ 320 $ 485 $ 163
2014 Multi-Year Productivity Plan
The 2014 Productivity Plan includes the next generation of productivity initiatives that we believe will
strengthen our food, snack and beverage businesses by: accelerating our investment in manufacturing
automation; further optimizing our global manufacturing footprint, including closing certain manufacturing
facilities; re-engineering our go-to-market systems in developed markets; expanding shared services; and
implementing simplified organization structures to drive efficiency. The 2014 Productivity Plan is in addition
to the 2012 Productivity Plan and is expected to continue the benefits of that plan.
In 2015, 2014 and 2013, we incurred restructuring charges of $169 million ($134 million after-tax or $0.09
per share), $357 million ($262 million after-tax or $0.17 per share) and $53 million ($39 million or $0.02
per share), respectively, in conjunction with our 2014 Productivity Plan. All of these charges were recorded
in selling, general and administrative expenses and primarily relate to severance and other employee-related
costs, asset impairments (all non-cash), and other costs associated with the implementation of our initiatives,
including contract termination costs. Substantially all of the restructuring accrual at December 26, 2015 is
expected to be paid by the end of 2016.