Pepsi 2015 Annual Report Download - page 128
Download and view the complete annual report
Please find page 128 of the 2015 Pepsi annual report below. You can navigate through the pages in the report by either clicking on the pages listed below, or by using the keyword search tool below to find specific information within the annual report.-
 1
1 -
2
-
3
-
4
-
5
-
6
-
7
-
8
-
9
-
10
-
11
-
12
-
13
-
14
-
15
-
16
-
17
-
18
-
19
-
20
-
21
-
22
-
23
-
24
-
25
-
26
-
27
-
28
-
29
-
30
-
31
-
32
-
33
-
34
-
35
-
36
-
37
-
38
-
39
-
40
-
41
-
42
-
43
-
44
-
45
-
46
-
47
-
48
-
49
-
50
-
51
-
52
-
53
-
54
-
55
-
56
-
57
-
58
-
59
-
60
-
61
-
62
-
63
-
64
-
65
-
66
-
67
-
68
-
69
-
70
-
71
-
72
-
73
-
74
-
75
-
76
-
77
-
78
-
79
-
80
-
81
-
82
-
83
-
84
-
85
-
86
-
87
-
88
-
89
-
90
-
91
-
92
-
93
-
94
-
95
-
96
-
97
-
98
-
99
-
100
-
101
-
102
-
103
-
104
-
105
-
106
-
107
-
108
-
109
-
110
-
111
-
112
-
113
-
114
-
115
-
116
-
117
-
 118
118 -
 119
119 -
 120
120 -
 121
121 -
 122
122 -
 123
123 -
 124
124 -
 125
125 -
 126
126 -
 127
127 -
 128
128 -
 129
129 -
 130
130 -
 131
131 -
 132
132 -
 133
133 -
 134
134 -
 135
135 -
 136
136 -
 137
137 -
 138
138 -
139
-
140
-
141
-
142
-
143
-
144
-
145
-
146
-
147
-
148
-
149
-
150
-
151
-
152
-
153
-
154
-
155
-
156
-
157
-
158
-
159
-
160
-
161
-
162
-
163
-
164
-
165
-
166
-
167
-
168
 |
 |

Table of Contents
111
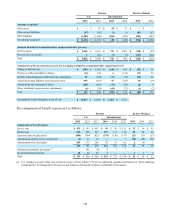
or interest rate risks are classified as operating activities in the Consolidated Statement of Cash Flows. We
classify both the earnings and cash flow impact from these derivatives consistent with the underlying hedged
item. See “Our Business Risks” in Management’s Discussion and Analysis of Financial Condition and Results
of Operations for further unaudited information on our business risks.
For cash flow hedges, the effective portion of changes in fair value is deferred in accumulated other
comprehensive loss within common shareholders’ equity until the underlying hedged item is recognized in
net income. For fair value hedges, changes in fair value are recognized immediately in earnings, consistent
with the underlying hedged item. Hedging transactions are limited to an underlying exposure. As a result,
any change in the value of our derivative instruments would be substantially offset by an opposite change
in the value of the underlying hedged items. We do not use derivative instruments for trading or speculative
purposes. We perform assessments of our counterparty credit risk regularly, including reviewing netting
agreements, if any, and a review of credit ratings, credit default swap rates and potential nonperformance of
the counterparty. Based on our most recent assessment of our counterparty credit risk, we consider this risk
to be low. In addition, we enter into derivative contracts with a variety of financial institutions that we believe
are creditworthy in order to reduce our concentration of credit risk.
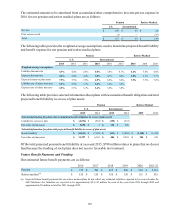
Commodity Prices
We are subject to commodity price risk because our ability to recover increased costs through higher pricing
may be limited in the competitive environment in which we operate. This risk is managed through the use
of fixed-price contracts and purchase orders, pricing agreements and derivative instruments, which include
swaps and futures. In addition, risk to our supply of certain raw materials is mitigated through purchases
from multiple geographies and suppliers. We use derivatives, with terms of no more than three years, to
economically hedge price fluctuations related to a portion of our anticipated commodity purchases, primarily
for agricultural products, metals and energy. Ineffectiveness for those derivatives that qualify for hedge
accounting treatment was not material for all periods presented. Derivatives used to hedge commodity price
risk that do not qualify for hedge accounting treatment are marked to market each period with the resulting
gains and losses recorded in corporate unallocated expenses as either cost of sales or selling, general and
administrative expenses, depending on the underlying commodity. These gains and losses are subsequently
reflected in division results when the divisions recognize the cost of the underlying commodity in operating
profit.
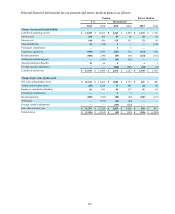
Our open commodity derivative contracts had a notional value of $1.0 billion as of December 26, 2015 and
$1.2 billion as of December 27, 2014.
Foreign Exchange
Our operations outside of the U.S. generated 44% of our net revenue in 2015, with Mexico, Russia, Canada,
the United Kingdom and Brazil comprising approximately 20% of our net revenue in 2015. As a result, we
are exposed to foreign exchange risks in the international markets in which our products are made,
manufactured, distributed or sold.
Additionally, we are exposed to foreign exchange risk from foreign currency purchases and foreign currency
assets and liabilities created in the normal course of business. We manage this risk through sourcing purchases
from local suppliers, negotiating contracts in local currencies with foreign suppliers and through the use of
derivatives, primarily forward contracts with terms of no more than two years. Exchange rate gains or losses
related to foreign currency transactions are recognized as transaction gains or losses in our income statement
as incurred.