Pepsi 2015 Annual Report Download - page 51
Download and view the complete annual report
Please find page 51 of the 2015 Pepsi annual report below. You can navigate through the pages in the report by either clicking on the pages listed below, or by using the keyword search tool below to find specific information within the annual report.-
 1
1 -
2
-
3
-
4
-
5
-
6
-
7
-
8
-
9
-
10
-
11
-
12
-
13
-
14
-
15
-
16
-
17
-
18
-
19
-
20
-
21
-
22
-
23
-
24
-
25
-
26
-
27
-
28
-
29
-
30
-
31
-
32
-
33
-
34
-
35
-
36
-
37
-
38
-
39
-
40
-
 41
41 -
 42
42 -
 43
43 -
 44
44 -
 45
45 -
 46
46 -
 47
47 -
 48
48 -
 49
49 -
 50
50 -
 51
51 -
 52
52 -
 53
53 -
 54
54 -
 55
55 -
 56
56 -
 57
57 -
 58
58 -
 59
59 -
 60
60 -
 61
61 -
62
-
63
-
64
-
65
-
66
-
67
-
68
-
69
-
70
-
71
-
72
-
73
-
74
-
75
-
76
-
77
-
78
-
79
-
80
-
81
-
82
-
83
-
84
-
85
-
86
-
87
-
88
-
89
-
90
-
91
-
92
-
93
-
94
-
95
-
96
-
97
-
98
-
99
-
100
-
101
-
102
-
103
-
104
-
105
-
106
-
107
-
108
-
109
-
110
-
111
-
112
-
113
-
114
-
115
-
116
-
117
-
118
-
119
-
120
-
121
-
122
-
123
-
124
-
125
-
126
-
127
-
128
-
129
-
130
-
131
-
132
-
133
-
134
-
135
-
136
-
137
-
138
-
139
-
140
-
141
-
142
-
143
-
144
-
145
-
146
-
147
-
148
-
149
-
150
-
151
-
152
-
153
-
154
-
155
-
156
-
157
-
158
-
159
-
160
-
161
-
162
-
163
-
164
-
165
-
166
-
167
-
168
 |
 |

Table of Contents
34
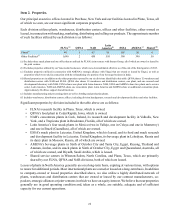
Item 6. Selected Financial Data.
Five-Year Summary
(unaudited, in millions except per share amounts)
The following selected financial data should be read in conjunction with “Item 7. Management’s Discussion
and Analysis of Financial Condition and Results of Operations,” our consolidated financial statements and
accompanying notes thereto. Our fiscal year 2011 comprised fifty-three reporting weeks and all other fiscal
years presented in the tables below comprised fifty-two reporting weeks.
2015 2014 2013 2012 2011
Net revenue $ 63,056 $ 66,683 $ 66,415 $ 65,492 $ 66,504
Net income attributable to PepsiCo (a) $ 5,452 $ 6,513 $ 6,740 $ 6,178 $ 6,443
Net income attributable to PepsiCo per common
share – basic (a) $ 3.71 $ 4.31 $ 4.37 $ 3.96 $ 4.08
Net income attributable to PepsiCo per common
share – diluted (a) $ 3.67 $ 4.27 $ 4.32 $ 3.92 $ 4.03
Cash dividends declared per common share $ 2.7625 $ 2.5325 $ 2.24 $ 2.1275 $ 2.025
Total assets (a) $ 69,667 $ 70,509 $ 77,478 $ 74,638 $ 72,882
Long-term debt $ 29,213 $ 23,821 $ 24,333 $ 23,544 $ 20,568
Return on invested capital(a) (b) 13.1% 13.2% 14.0% 13.7% 14.3%
(a) Reflects the impact of the Venezuela impairment charges of $1.4 billion in 2015.
(b) Return on invested capital (ROIC) is defined as adjusted net income attributable to PepsiCo divided by the sum of average common
shareholders’ equity and average total debt. Adjusted net income attributable to PepsiCo is defined as net income attributable to PepsiCo
plus interest expense after-tax. Interest expense after-tax was $621 million in 2015, $582 million in 2014, $583 million in 2013, $576 million
in 2012 and $548 million in 2011.
The following information highlights certain items that impacted our results of operations and financial
condition for the five years presented above:
• Includes mark-to-market net (gains)/losses of:
2015 2014 2013 2012 2011
Pre-tax $(11)$ 68 $ 72 $ (65) $ 102
After-tax $(8)$ 44 $ 44 $ (41) $ 71
Per share $—
$ 0.03 $ 0.03 $ (0.03) $ 0.04
• Includes restructuring and impairment charges related to the 2014 and 2012 Multi-Year Productivity Plans of:
2015 2014 2013 2012 2011
Pre-tax $ 230 $ 418 $ 163 $ 279 $ 383
After-tax $ 184 $ 316 $ 129 $ 215 $ 286
Per share $ 0.12 $ 0.21 $ 0.08 $ 0.14 $ 0.18
• Includes charges related to productivity initiatives outside the scope of the 2014 and 2012 Multi-Year Productivity Plans of:
2015 2014
Pre-tax $ 90 $ 67
After-tax $ 66 $ 54
Per share $ 0.04 $ 0.04