Pepsi 2015 Annual Report Download - page 131
Download and view the complete annual report
Please find page 131 of the 2015 Pepsi annual report below. You can navigate through the pages in the report by either clicking on the pages listed below, or by using the keyword search tool below to find specific information within the annual report.-
 1
1 -
2
-
3
-
4
-
5
-
6
-
7
-
8
-
9
-
10
-
11
-
12
-
13
-
14
-
15
-
16
-
17
-
18
-
19
-
20
-
21
-
22
-
23
-
24
-
25
-
26
-
27
-
28
-
29
-
30
-
31
-
32
-
33
-
34
-
35
-
36
-
37
-
38
-
39
-
40
-
41
-
42
-
43
-
44
-
45
-
46
-
47
-
48
-
49
-
50
-
51
-
52
-
53
-
54
-
55
-
56
-
57
-
58
-
59
-
60
-
61
-
62
-
63
-
64
-
65
-
66
-
67
-
68
-
69
-
70
-
71
-
72
-
73
-
74
-
75
-
76
-
77
-
78
-
79
-
80
-
81
-
82
-
83
-
84
-
85
-
86
-
87
-
88
-
89
-
90
-
91
-
92
-
93
-
94
-
95
-
96
-
97
-
98
-
99
-
100
-
101
-
102
-
103
-
104
-
105
-
106
-
107
-
108
-
109
-
110
-
111
-
112
-
113
-
114
-
115
-
116
-
117
-
118
-
119
-
120
-
 121
121 -
 122
122 -
 123
123 -
 124
124 -
 125
125 -
 126
126 -
 127
127 -
 128
128 -
 129
129 -
 130
130 -
 131
131 -
 132
132 -
 133
133 -
 134
134 -
 135
135 -
 136
136 -
 137
137 -
 138
138 -
 139
139 -
 140
140 -
 141
141 -
142
-
143
-
144
-
145
-
146
-
147
-
148
-
149
-
150
-
151
-
152
-
153
-
154
-
155
-
156
-
157
-
158
-
159
-
160
-
161
-
162
-
163
-
164
-
165
-
166
-
167
-
168
 |
 |
Table of Contents
114
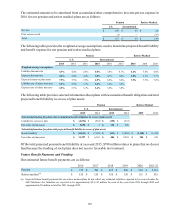
Fair Value Measurements
The fair values of our financial assets and liabilities as of December 26, 2015 and December 27, 2014 are
categorized as follows:
2015 2014
Assets(a) Liabilities(a) Assets(a) Liabilities(a)
Available-for-sale securities:
Equity securities (b) $ 127 $ — $ 124 $ —
Debt securities (c) 7,231 — 3,167 —
$ 7,358 $ — $ 3,291 $ —
Short-term investments (d) $ 193 $ — $ 197 $ —
Prepaid forward contracts (e) $ 27 $ — $26$—
Deferred compensation (f) $ — $ 474 $ — $ 504
Derivatives designated as fair value hedging
instruments:
Interest rate (g) $ 129 $ 12 $ 140 $ —
Derivatives designated as cash flow hedging
instruments:
Foreign exchange (h) $ 76 $ 6 $ 76 $ 12
Interest rate (g) — 311 1 117
Commodity (i) —73 10
$ 76 $ 324 $ 80 $ 139
Derivatives not designated as hedging
instruments:
Foreign exchange (h) $ 8 $ 10 $ 12 $ 13
Interest rate (g) 44 56 57 75
Commodity (i) 12 141 18 166
$ 64 $ 207 $ 87 $ 254
Total derivatives at fair value(j) $ 269 $ 543 $ 307 $ 393
Total $ 7,847 $ 1,017 $ 3,821 $ 897
(a) Unless otherwise noted, financial assets are classified on our Consolidated Balance Sheet within prepaid expenses and other current assets
and other assets. Financial liabilities are classified on our Consolidated Balance Sheet within accounts payable and other current liabilities
and other liabilities. Unless specifically indicated, all financial assets and liabilities are categorized as Level 2 assets or liabilities.
(b) Based on the price of common stock. Categorized as a Level 1 asset. These equity securities are classified as investments in noncontrolled
affiliates.
(c) Based on quoted broker prices or other significant inputs derived from or corroborated by observable market data. As of December 26,
2015, $4.5 billion and $2.7 billion of debt securities were classified as cash equivalents and short-term investments, respectively. As of
December 27, 2014, $0.8 billion and $2.4 billion of debt securities were classified as cash equivalents and short-term investments,
respectively. All of the Company’s available-for-sale debt securities have maturities of one year or less.
(d) Based on the price of index funds. Categorized as a Level 1 asset. These investments are classified as short-term investments and are used
to manage a portion of market risk arising from our deferred compensation liability.
(e) Based primarily on the price of our common stock.
(f) Based on the fair value of investments corresponding to employees’ investment elections.
(g) Based on LIBOR forward rates. As of December 26, 2015 and December 27, 2014, amounts related to non-designated instruments are
presented on a net basis on our Consolidated Balance Sheet.
(h) Based on recently reported market transactions of spot and forward rates.
(i) Based on recently reported market transactions, primarily swap arrangements.
(j) Unless otherwise noted, derivative assets and liabilities are presented on a gross basis on our Consolidated Balance Sheet. Amounts subject
to enforceable master netting arrangements or similar agreements which are not offset on the Consolidated Balance Sheet as of December 26,
2015 and December 27, 2014 were immaterial. Collateral received against any of our asset positions was immaterial.