Pepsi 2015 Annual Report Download - page 69
Download and view the complete annual report
Please find page 69 of the 2015 Pepsi annual report below. You can navigate through the pages in the report by either clicking on the pages listed below, or by using the keyword search tool below to find specific information within the annual report.-
 1
1 -
2
-
3
-
4
-
5
-
6
-
7
-
8
-
9
-
10
-
11
-
12
-
13
-
14
-
15
-
16
-
17
-
18
-
19
-
20
-
21
-
22
-
23
-
24
-
25
-
26
-
27
-
28
-
29
-
30
-
31
-
32
-
33
-
34
-
35
-
36
-
37
-
38
-
39
-
40
-
41
-
42
-
43
-
44
-
45
-
46
-
47
-
48
-
49
-
50
-
51
-
52
-
53
-
54
-
55
-
56
-
57
-
58
-
 59
59 -
 60
60 -
 61
61 -
 62
62 -
 63
63 -
 64
64 -
 65
65 -
 66
66 -
 67
67 -
 68
68 -
 69
69 -
 70
70 -
 71
71 -
 72
72 -
 73
73 -
 74
74 -
 75
75 -
 76
76 -
 77
77 -
 78
78 -
 79
79 -
80
-
81
-
82
-
83
-
84
-
85
-
86
-
87
-
88
-
89
-
90
-
91
-
92
-
93
-
94
-
95
-
96
-
97
-
98
-
99
-
100
-
101
-
102
-
103
-
104
-
105
-
106
-
107
-
108
-
109
-
110
-
111
-
112
-
113
-
114
-
115
-
116
-
117
-
118
-
119
-
120
-
121
-
122
-
123
-
124
-
125
-
126
-
127
-
128
-
129
-
130
-
131
-
132
-
133
-
134
-
135
-
136
-
137
-
138
-
139
-
140
-
141
-
142
-
143
-
144
-
145
-
146
-
147
-
148
-
149
-
150
-
151
-
152
-
153
-
154
-
155
-
156
-
157
-
158
-
159
-
160
-
161
-
162
-
163
-
164
-
165
-
166
-
167
-
168
 |
 |
Table of Contents
52
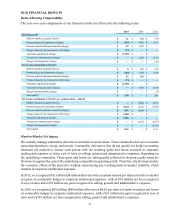
OUR FINANCIAL RESULTS
Items Affecting Comparability
The year-over-year comparisons of our financial results are affected by the following items:
2015 2014 2013
Operating profit
Mark-to-market net gains/(losses) $ 11 $ (68) $ (72)
Restructuring and impairment charges $ (230) $ (418) $ (163)
Pension-related settlement benefits/(charge) $ 67 $ (141) $ —
Charge related to the transaction with Tingyi $ (73) $—$—
Venezuela impairment charges $ (1,359) $—$—
Venezuela remeasurement charges $—
$ (105) $ (111)
Merger and integration charges $—
$ — $ (10)
Net income attributable to PepsiCo
Mark-to-market net gains/(losses) $8
$ (44) $ (44)
Restructuring and impairment charges $ (184) $ (316) $ (129)
Pension-related settlement benefits/(charge) $ 42 $ (88) $ —
Charge related to the transaction with Tingyi $ (73) $—$—
Venezuela impairment charges $ (1,359) $—$—
Venezuela remeasurement charges $—
$ (105) $ (111)
Merger and integration charges $—
$ — $ (8)
Tax benefits $ 230 $ — $ 209
Net income attributable to PepsiCo per common share – diluted
Mark-to-market net gains/(losses) $—
$ (0.03) $ (0.03)
Restructuring and impairment charges $ (0.12) $ (0.21) $ (0.08)
Pension-related settlement benefits/(charge) $ 0.03 $ (0.06) $ —
Charge related to the transaction with Tingyi $ (0.05) $—$—
Venezuela impairment charges $ (0.91) $—$—
Venezuela remeasurement charges $—
$ (0.07) $ (0.07)
Merger and integration charges $—
$ — $ (0.01)
Tax benefits $ 0.15 $ — $ 0.13
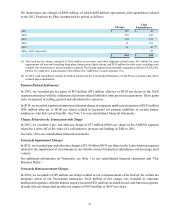
Mark-to-Market Net Impact
We centrally manage commodity derivatives on behalf of our divisions. These commodity derivatives include
agricultural products, energy and metals. Commodity derivatives that do not qualify for hedge accounting
treatment are marked to market each period with the resulting gains and losses recorded in corporate
unallocated expenses as either cost of sales or selling, general and administrative expenses, depending on
the underlying commodity. These gains and losses are subsequently reflected in division results when the
divisions recognize the cost of the underlying commodity in operating profit. Therefore, the divisions realize
the economic effects of the derivative without experiencing any resulting mark-to-market volatility, which
remains in corporate unallocated expenses.
In 2015, we recognized $11 million ($8 million after-tax with a nominal amount per share) of mark-to-market
net gains on commodity hedges in corporate unallocated expenses, with an $18 million net loss recognized
in cost of sales and a $29 million net gain recognized in selling, general and administrative expenses.
In 2014, we recognized $68 million ($44 million after-tax or $0.03 per share) of mark-to-market net losses
on commodity hedges in corporate unallocated expenses, with a $33 million net gain recognized in cost of
sales and a $101 million net loss recognized in selling, general and administrative expenses.