Qantas 2003 Annual Report Download - page 7
Download and view the complete annual report
Please find page 7 of the 2003 Qantas annual report below. You can navigate through the pages in the report by either clicking on the pages listed below, or by using the keyword search tool below to find specific information within the annual report.-
 1
1 -
 2
2 -
 3
3 -
 4
4 -
 5
5 -
 6
6 -
 7
7 -
 8
8 -
 9
9 -
 10
10 -
 11
11 -
 12
12 -
 13
13 -
 14
14 -
 15
15 -
 16
16 -
 17
17 -
 18
18 -
19
-
20
-
21
-
22
-
23
-
24
-
25
-
26
-
27
-
28
-
29
-
30
-
31
-
32
-
33
-
34
-
35
-
36
-
37
-
38
-
39
-
40
-
41
-
42
-
43
-
44
-
45
-
46
-
47
-
48
-
49
-
50
-
51
-
52
-
53
-
54
-
55
-
56
-
57
-
58
-
59
-
60
 |
 |
page 5
Spirit of Australia
OUR STRATEGY
While Qantas is profitable and has performed better than most
of its peers in the current environment, it must continue to
improve its profitability to create sustainable shareholder value.
Only by achieving satisfactory profitability can Qantas continue
to invest in new aircraft, product and service initiatives.
A key strategy to attain these objectives is a project called
Sustainable Future. Launched in February 2003, the Sustainable
Future project aims to reduce operating costs by $1 billion over
the next two years.
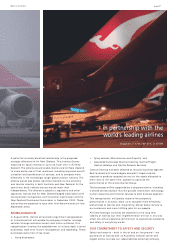
Qantas is also implementing strategies to maintain its position
as the leading Australian domestic carrier and one of the world’s
premier long haul airlines.
The key elements in achieving these objectives are:
reducing costs;
upgrading and expanding the fleet to improve efficiency
(see pages 20 and 21);
maintaining a flexible and diversified network;
maintaining current alliances and seeking mutually beneficial
relationships with other quality airlines (see page 7 and 13);
improving the profitability of the Qantas Group’s non-flying,
airline-related businesses (see pages 17 to 19);
maintaining financial strength; and
investing in product and customer service initiatives
(see pages 8, 9, 11, 12 and 15).
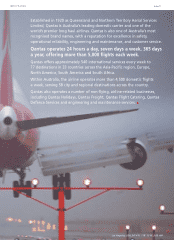
and 58 destinations across Australia
Uluru, Australia_25º 23‘S 131º 5‘E_11.30 AM
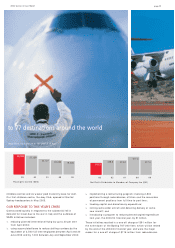
Sales and Operating Revenue ($M)
9900010203
11,374.9 10,968.8 10,188.2 9,106.8 8,448.7
Ordinary Dividends per Share* (Cents per Share)
* Excludes special dividends paid
Final
Interim
9900010203
9.0 9.0 11.0
11.0
11.0 11.0 8.0
8.0
9.0
8.0
20.0 22.0 19.0
17.0
17.0