Qantas 2003 Annual Report Download - page 8
Download and view the complete annual report
Please find page 8 of the 2003 Qantas annual report below. You can navigate through the pages in the report by either clicking on the pages listed below, or by using the keyword search tool below to find specific information within the annual report.-
 1
1 -
 2
2 -
 3
3 -
 4
4 -
 5
5 -
 6
6 -
 7
7 -
 8
8 -
 9
9 -
 10
10 -
 11
11 -
 12
12 -
 13
13 -
 14
14 -
 15
15 -
 16
16 -
 17
17 -
 18
18 -
 19
19 -
20
-
21
-
22
-
23
-
24
-
25
-
26
-
27
-
28
-
29
-
30
-
31
-
32
-
33
-
34
-
35
-
36
-
37
-
38
-
39
-
40
-
41
-
42
-
43
-
44
-
45
-
46
-
47
-
48
-
49
-
50
-
51
-
52
-
53
-
54
-
55
-
56
-
57
-
58
-
59
-
60
 |
 |
page 6
2003 Qantas Annual Report
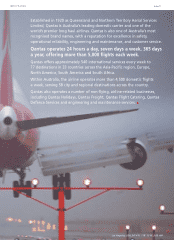
operating a fleet of 196 aircraft
Los Angeles, USA_34º 4‘N 118º 15‘W_7.00 AM
Year Ended 30 June 2003 2002 2001 2000 1999
Sales and Operating Revenue $M 11,374.9 10,968.8 10,188.2 9,106.8 8,448.7
Earnings Before Interest and Tax $M 567.0 679.3 695.8 874.0 762.6
Profit From Ordinary Activities Before Tax $M 502.3 631.0 597.1 762.8 662.5
Net Profit Attributable to Members of the Company $M 343.5 428.0 415.4 517.3 421.6
Earnings per Share cents 20.0 29.1 33.0 42.8 35.4
Ordinary Dividends per Share cents 17.0 17.0 20.0 22.0 19.0
Passengers Carried 000 28,884 27,128 22,147 20,485 19,236
Available Seat Kilometres M 99,509 95,944 92,943 85,033 81,765
Revenue Passenger Kilometres M 77,225 75,134 70,540 64,149 59,863
Revenue Seat Factor % 77.6 78.3 75.9 75.4 73.2
Aircraft in Service at Balance Date # 196 193 178 147 135