AT&T Wireless 2011 Annual Report Download - page 38
Download and view the complete annual report
Please find page 38 of the 2011 AT&T Wireless annual report below. You can navigate through the pages in the report by either clicking on the pages listed below, or by using the keyword search tool below to find specific information within the annual report.-
 1
1 -
2
-
3
-
4
-
5
-
6
-
7
-
8
-
9
-
10
-
11
-
12
-
13
-
14
-
15
-
16
-
17
-
18
-
19
-
20
-
21
-
22
-
23
-
24
-
25
-
26
-
27
-
 28
28 -
 29
29 -
 30
30 -
 31
31 -
 32
32 -
 33
33 -
 34
34 -
 35
35 -
 36
36 -
 37
37 -
 38
38 -
 39
39 -
 40
40 -
 41
41 -
 42
42 -
 43
43 -
 44
44 -
 45
45 -
 46
46 -
 47
47 -
 48
48 -
49
-
50
-
51
-
52
-
53
-
54
-
55
-
56
-
57
-
58
-
59
-
60
-
61
-
62
-
63
-
64
-
65
-
66
-
67
-
68
-
69
-
70
-
71
-
72
-
73
-
74
-
75
-
76
-
77
-
78
-
79
-
80
-
81
-
82
-
83
-
84
-
85
-
86
-
87
-
88
-
89
-
90
-
91
-
92
-
93
-
94
-
95
-
96
-
97
-
98
-
99
-
100
 |
 |

Management’s Discussion and Analysis of Financial Condition and Results of Operations (continued)
Dollars in millions except per share amounts
36 AT&T Inc.
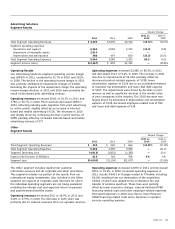
•Sellingexpenses(otherthancommissions)increased
$288 due to higher payroll and benefits costs, bad debt
expense, and advertising, partially offset by lower costs
associated with customer billing functions.
Partially offsetting these increases in 2011 were the following:
•Reseller,USF,andincollectroamingfeesdecreased
$280 primarily due to lower usage and handset insurance
costs, less the impact of a USF rate increase.
•Administrativeexpensesdecreased$216dueto
lower payroll, legal and operating tax costs, and a
reclassification of shared information technology costs.
The increase in 2010 was primarily due to the following:
•Highervolumesofadvancedhandsetsalesandupgrades
increased equipment costs $1,340 and commission
expenses $132.
•Interconnect,USFandnetworksystemcostsincreased
$1,103 due to higher network traffic, network
enhancement efforts, revenue growth and a USF rate
increase. These increases were partially offset by reseller
service and long-distance cost decreases, totaling $93,
due to lower usage.
•Administrativeexpensesincreased$432dueinpart
to higher leasing, legal, and benefits costs.
•Sellingexpenses(otherthancommissions)increased
$201, primarily due to increased advertising, partially
offset by lower bad debt expense and customer
service costs.
Depreciation and amortization expenses decreased $173, or
2.7%, in 2011 and increased $454, or 7.5%, in 2010. In 2011,
amortization expense decreased $524, or 39.7%, primarily
due to lower amortization of intangibles for customer lists
related to acquisitions. Depreciation expense increased $351,
or 6.8%, primarily due to ongoing capital spending for network
upgrades and expansion and the reclassification of shared
information technology costs partially offset by certain
network assets becoming fully depreciated.
Depreciation expense increased $751, or 17.0%, in 2010
primarily due to increased capital spending for network
upgrades and expansion and depreciation for assets acquired
with the acquisition of Centennial Communications Corp.
(Centennial), partially offset by certain network assets
becoming fully depreciated. Amortization expense decreased
$297, or 18.4%, in 2010 primarily due to lower amortization
of intangibles for customer lists related to acquisitions,
partially offset by an increase in customer lists amortization
related to the Centennial acquisition.
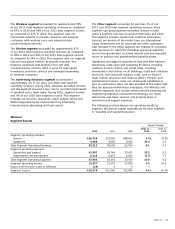
Service revenues are comprised of local voice and data
services, roaming, long distance and other revenue. Service
revenues increased $3,216, or 6.0%, in 2011 and $4,947, or
10.2%, in 2010. The increases consisted of the following:
•Dataservicerevenuesincreased$3,824,or21.0%,in
2011 and $4,052, or 28.7%, in 2010. The increases were
primarily due to the increased number of subscribers and
increased Internet access by subscribers using advanced
handsets and data-centric devices, such as eReaders,
tablets, and mobile navigation devices. Data service
revenues accounted for approximately 38.8% of our
wireless service revenues in 2011, compared to 34.0%
in 2010 and 29.1% in 2009.
•Voiceandotherservicerevenuesdecreased$608,or
1.7%, in 2011 and increased $895, or 2.6%, in 2010.
While the number of wireless subscribers increased 8.1%
in 2011, these revenues continued to decline due to
pricing decisions and usage declines, as noted in the
ARPU and subscriber relationships discussions above.
The increase in 2010 was due to a 12.2% increase in
the number of wireless subscribers partially offset by
declining ARPU.
Equipment revenues increased $1,496, or 30.0%, in 2011 and
$49, or 1.0%, in 2010. The increase in 2011 was primarily due
to the launch of this year’s iPhone model, which resulted in
even higher iPhone sales and upgrades when compared to
iPhone sales and upgrades during last year’s model launch,
and higher sales of Android devices and other smartphones
in 2011. As previously noted, an increasing share of our
postpaid subscriber base now uses a smartphone, and
manufacturers continue to introduce smartphones to the
marketplace. Our mix of smartphone sales as a percentage
of total sales and upgrades to postpaid subscribers has
continued to increase contributing to the year-over-year
increase in equipment revenues.
The increase in 2010 was primarily due to higher sales
and upgrades of postpaid smartphones and other advanced
handsets.
Operations and support expenses increased $4,835, or
13.2%, in 2011 and $3,115, or 9.3%, in 2010. The increase
in 2011 was primarily due to the following:
•Highervolumesofsmartphonesalesandhandset
upgrades, as well as handsets provided to former Alltel
subscribers, increased equipment costs $2,836 and
related commission expenses $1,080.
•Networksystem,interconnect,andlong-distancecosts
increased $1,132 due to higher network traffic, higher
recurring personnel-related network support costs in
conjunction with our network enhancement efforts,
and higher leasing costs.