AT&T Wireless 2011 Annual Report Download - page 69
Download and view the complete annual report
Please find page 69 of the 2011 AT&T Wireless annual report below. You can navigate through the pages in the report by either clicking on the pages listed below, or by using the keyword search tool below to find specific information within the annual report.-
 1
1 -
2
-
3
-
4
-
5
-
6
-
7
-
8
-
9
-
10
-
11
-
12
-
13
-
14
-
15
-
16
-
17
-
18
-
19
-
20
-
21
-
22
-
23
-
24
-
25
-
26
-
27
-
28
-
29
-
30
-
31
-
32
-
33
-
34
-
35
-
36
-
37
-
38
-
39
-
40
-
41
-
42
-
43
-
44
-
45
-
46
-
47
-
48
-
49
-
50
-
51
-
52
-
53
-
54
-
55
-
56
-
57
-
58
-
 59
59 -
 60
60 -
 61
61 -
 62
62 -
 63
63 -
 64
64 -
 65
65 -
 66
66 -
 67
67 -
 68
68 -
 69
69 -
 70
70 -
 71
71 -
 72
72 -
 73
73 -
 74
74 -
 75
75 -
 76
76 -
 77
77 -
 78
78 -
 79
79 -
80
-
81
-
82
-
83
-
84
-
85
-
86
-
87
-
88
-
89
-
90
-
91
-
92
-
93
-
94
-
95
-
96
-
97
-
98
-
99
-
100
 |
 |

AT&T Inc. 67
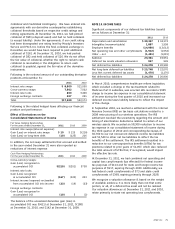
Segment Results, including a reconciliation to AT&T consolidated results, for 2011, 2010, and 2009 are as follows:
Advertising Consolidated
At December 31, 2011 and for the year ended Wireless Wireline Solutions Other Consolidations Results
Total segment operating revenues $ 63,212 $ 59,765 $ 3,293 $ 453 $ — $126,723
Operations and support expenses 41,581 40,879 5,174 5,214 6,280 99,128
Depreciation and amortization expenses 6,324 11,615 386 52 — 18,377
Total segment operating expenses 47,905 52,494 5,560 5,266 6,280 117,505
Segment operating income (loss) 15,307 7,271 (2,267) (4,813) (6,280) 9,218
Interest expense — — — — 3,535 3,535
Equity in net income (loss) of affiliates (29) — — 813 — 784
Other income (expense) – net — — — — 249 249
Segment income (loss) before income taxes $ 15,278 $ 7,271 $(2,267) $ (4,000) $(9,566) $ 6,716
Segment assets $127,401 $135,563 $ 3,011 $10,432 $(6,063) $270,344
Investments in equity method affiliates 20 — — 3,698 — 3,718
Expenditures for additions to long-lived assets 9,759 10,455 29 29 — 20,272
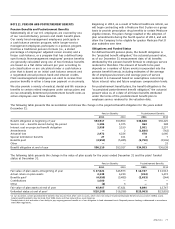
Advertising Consolidated
At December 31, 2010 and for the year ended Wireless Wireline Solutions Other Consolidations Results
Total segment operating revenues $ 58,500 $ 61,300 $ 3,935 $ 545 $ — $ 124,280
Operations and support expenses 36,746 41,096 2,583 2,382 2,521 85,328
Depreciation and amortization expenses 6,497 12,371 497 14 — 19,379
Total segment operating expenses 43,243 53,467 3,080 2,396 2,521 104,707
Segment operating income (loss) 15,257 7,833 855 (1,851) (2,521) 19,573
Interest expense — — — — 2,994 2,994
Equity in net income of affiliates 9 11 — 742 — 762
Other income (expense) – net — — — — 897 897
Segment income (loss) before income taxes $ 15,266 $ 7,844 $ 855 $ (1,109) $ (4,618) $ 18,238
Segment assets $ 122,016 $ 134,900 $ 8,369 $ 9,113 $ (5,007) $ 269,391
Investments in equity method affiliates 14 — — 4,501 — 4,515
Expenditures for additions to long-lived assets 9,171 11,071 29 31 — 20,302
Advertising Consolidated
For the year ended December 31, 2009 Wireless Wireline Solutions Other Consolidations Results
Total segment operating revenues $ 53,504 $ 63,621 $ 4,724 $ 664 $ — $ 122,513
Operations and support expenses 33,631 42,439 2,743 2,970 215 81,998
Depreciation and amortization expenses 6,043 12,743 650 79 — 19,515
Total segment operating expenses 39,674 55,182 3,393 3,049 215 101,513
Segment operating income (loss) 13,830 8,439 1,331 (2,385) (215) 21,000
Interest expense — — — — 3,368 3,368
Equity in net income of affiliates 9 17 — 708 — 734
Other income (expense) – net — — — — 152 152
Segment income (loss) before income taxes $ 13,839 $ 8,456 $ 1,331 $ (1,677) $ (3,431) $ 18,518