AT&T Wireless 2011 Annual Report Download - page 91
Download and view the complete annual report
Please find page 91 of the 2011 AT&T Wireless annual report below. You can navigate through the pages in the report by either clicking on the pages listed below, or by using the keyword search tool below to find specific information within the annual report.-
 1
1 -
2
-
3
-
4
-
5
-
6
-
7
-
8
-
9
-
10
-
11
-
12
-
13
-
14
-
15
-
16
-
17
-
18
-
19
-
20
-
21
-
22
-
23
-
24
-
25
-
26
-
27
-
28
-
29
-
30
-
31
-
32
-
33
-
34
-
35
-
36
-
37
-
38
-
39
-
40
-
41
-
42
-
43
-
44
-
45
-
46
-
47
-
48
-
49
-
50
-
51
-
52
-
53
-
54
-
55
-
56
-
57
-
58
-
59
-
60
-
61
-
62
-
63
-
64
-
65
-
66
-
67
-
68
-
69
-
70
-
71
-
72
-
73
-
74
-
75
-
76
-
77
-
78
-
79
-
80
-
 81
81 -
 82
82 -
 83
83 -
 84
84 -
 85
85 -
 86
86 -
 87
87 -
 88
88 -
 89
89 -
 90
90 -
 91
91 -
 92
92 -
 93
93 -
 94
94 -
 95
95 -
 96
96 -
 97
97 -
 98
98 -
 99
99 -
 100
100
 |
 |

AT&T Inc. 89
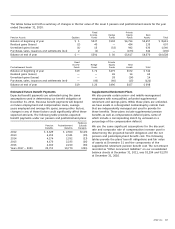
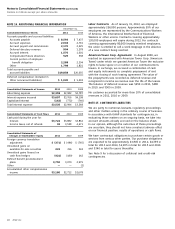
indicated years ended, was estimated at the date of grant
based on the expected life of the option and historical
exercise experience, using a Black-Scholes option pricing
model with the following weighted-average assumptions:
2011 2010 2009
Risk-free interest rate 2.91% 3.06% 3.17%
Dividend yield 5.96% 6.61% 6.82%
Expected volatility factor 14.74% 15.75% 19.65%
Expected option life in years 7.00 7.00 7.00
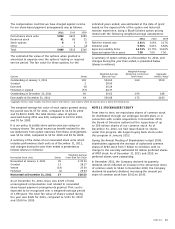
A summary of option activity as of December 31, 2011, and
changes during the year then ended, is presented below
(shares in millions):
The compensation cost that we have charged against income
for our share-based payment arrangements was as follows:
2011 2010 2009
Performance stock units $392 $421 $289
Restricted stock 91 85 21
Stock options 6 6 8
Other — 1 (2)
Total $489 $513 $316
The estimated fair value of the options when granted is
amortized to expense over the options’ vesting or required
service period. The fair value for these options, for the
Weighted-Average
Weighted-Average Remaining Contractual Aggregate
Options Shares Exercise Price Term (Years) Intrinsic Value1
Outstanding at January 1, 2011 130 $34.60 1.69 $150
Granted 2 28.90
Exercised (9) 26.24
Forfeited or expired (57) 40.37
Outstanding at December 31, 2011 66 30.62 1.99 148
Exercisable at December 31, 2011 64 $30.68 1.72 $145
1 Aggregate intrinsic value includes only those options with intrinsic value (options where the exercise price is below the market price).
The weighted-average fair value of each option granted during
the period was $1.57 for 2011, compared to $1.34 for 2010
and $1.84 for 2009. The total intrinsic value of options
exercised during 2011 was $40, compared to $13 for 2010,
and $5 for 2009.
It is our policy to satisfy share option exercises using our
treasury shares. The actual excess tax benefit realized for the
tax deductions from option exercises from these arrangements
was $2 for 2011, compared to $0 for 2010 and $0 for 2009.
A summary of the status of our nonvested stock units, which
includes performance stock units as of December 31, 2011,
and changes during the year then ended is presented as
follows (shares in millions):
Weighted-Average
Nonvested Stock Units Shares Grant-Date Fair Value
Nonvested at January 1, 2011 29 $ 25.30
Granted 13 28.17
Vested (14) 25.30
Forfeited (1) 25.93
Nonvested at December 31, 2011 27 $26.53
As of December 31, 2011, there was $329 of total
unrecognized compensation cost related to nonvested
share-based payment arrangements granted. That cost is
expected to be recognized over a weighted-average period
of 1.88 years. The total fair value of shares vested during
the year was $426 for 2011, compared to $331 for 2010
and $369 for 2009.
NOTE 13. STOCKHOLDERS’ EQUITY
From time to time, we repurchase shares of common stock
for distribution through our employee benefit plans or in
connection with certain acquisitions. In December 2010,
the Board of Directors authorized the repurchase of up
to 300 million shares of our common stock. As of
December 31, 2011, we had repurchased no shares
under this program. We began buying back stock under
this program in January 2012.
During the Annual Meeting of Shareholders in April 2009,
shareholders approved the increase of authorized common
shares of AT&T stock from 7 billion to 14 billion, with no
change to the currently authorized 10 million preferred shares
of AT&T stock. As of December 31, 2011 and 2010, no
preferred shares were outstanding.
In December 2011, the Company declared its quarterly
dividend, which reflected an increase in the amount per share
of common stock to $0.44. In December 2010, the Company
declared its quarterly dividend, increasing the amount per
share of common stock from $0.42 to $0.43.