AT&T Wireless 2011 Annual Report Download - page 40
Download and view the complete annual report
Please find page 40 of the 2011 AT&T Wireless annual report below. You can navigate through the pages in the report by either clicking on the pages listed below, or by using the keyword search tool below to find specific information within the annual report.-
 1
1 -
2
-
3
-
4
-
5
-
6
-
7
-
8
-
9
-
10
-
11
-
12
-
13
-
14
-
15
-
16
-
17
-
18
-
19
-
20
-
21
-
22
-
23
-
24
-
25
-
26
-
27
-
28
-
29
-
 30
30 -
 31
31 -
 32
32 -
 33
33 -
 34
34 -
 35
35 -
 36
36 -
 37
37 -
 38
38 -
 39
39 -
 40
40 -
 41
41 -
 42
42 -
 43
43 -
 44
44 -
 45
45 -
 46
46 -
 47
47 -
 48
48 -
 49
49 -
 50
50 -
51
-
52
-
53
-
54
-
55
-
56
-
57
-
58
-
59
-
60
-
61
-
62
-
63
-
64
-
65
-
66
-
67
-
68
-
69
-
70
-
71
-
72
-
73
-
74
-
75
-
76
-
77
-
78
-
79
-
80
-
81
-
82
-
83
-
84
-
85
-
86
-
87
-
88
-
89
-
90
-
91
-
92
-
93
-
94
-
95
-
96
-
97
-
98
-
99
-
100
 |
 |

Management’s Discussion and Analysis of Financial Condition and Results of Operations (continued)
Dollars in millions except per share amounts
38 AT&T Inc.
•Long-distancerevenuesdecreased$1,069,or11.0%,
in 2011 and $1,587, or 14.1%, in 2010. Lower demand
for long-distance service from global businesses and
consumer customers decreased revenues $828 in 2011
and $1,260 in 2010. Additionally, expected declines
in the number of national mass-market customers
decreased revenues $236 in 2011 and $332 in 2010.
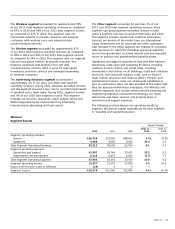
Other operating revenues decreased $385, or 7.1%, in 2011
and $219, or 3.9%, in 2010. Major items included in other
operating revenues are integration services and customer
premises equipment, government-related services and
outsourcing, which account for more than 60% of total
other revenue for both periods.
Operations and support expenses decreased $217, or 0.5%,
in 2011 and $1,343, or 3.2%, in 2010. Operations and support
expenses consist of costs incurred to provide our products
and services, including costs of operating and maintaining
our networks and personnel costs, such as compensation
and benefits.
The 2011 decrease was primarily due to lower employee-
related expense of $441, reflecting ongoing workforce
reduction initiatives, decreased traffic compensation expense
of $403 and lower bad debt expense of $213 due to lower
revenue from business customers and improvements in cash
collections. These decreases were partially offset by increased
cost of sales, primarily related to U-verse expansion-related
expenses of $461, increased nonemployee-related expenses
of $278 and increased contract services expense of $150.
The 2010 decrease was primarily due to lower employee-related
expense of $734, reflecting ongoing workforce reduction
initiatives, decreased traffic compensation expense of $452,
decreased contract services expense of $314 and lower bad
debt expense of $178 due to lower revenue from business
customers and improvements in cash collections. These
decreases were partially offset by increased cost of sales,
primarily related to U-verse expansion-related expenses of $369.
Depreciation and amortization expenses decreased $756,
or 6.1%, in 2011 and $372, or 2.9%, in 2010. Both decreases
were primarily related to lower amortization of intangibles
for customer lists associated with acquisitions.
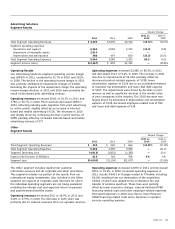
Supplemental Information
Telephone, Wireline Broadband and Video Connections Summary Our switched access lines and other services provided by
our local exchange telephone subsidiaries at December 31, 2011, 2010, and 2009 are shown below and trends are addressed
throughout this segment discussion.
Percent Change
2011 vs. 2010 vs.
(in 000s) 2011 2010 2009 2010 2009
Switched Access Lines1
Retail consumer 18,954 22,515 26,378 (15.8)% (14.6)%
Retail business2 15,613 17,006 18,486 (8.2) (8.0)
Retail Subtotal2 34,567 39,521 44,864 (12.5) (11.9)
Wholesale Subtotal2 2,120 2,300 2,590 (7.8) (11.2)
Total Switched Access Lines2,3 36,734 41,883 47,534 (12.3) (11.9)
Total Retail Consumer Voice Connections6 21,232 24,195 27,332 (12.2) (11.5)
Total Wireline Broadband Connections2,4 16,427 16,309 15,789 0.7 3.3
Satellite service5 1,765 1,930 2,174 (8.5) (11.2)
U-verse video 3,791 2,987 2,065 26.9 44.6
Video Connections 5,556 4,917 4,239 13.0% 16.0%
1Represents access lines served by AT&T’s Incumbent Local Exchange Carriers (ILECs) and affiliates.
2Prior-period amounts restated to conform to current-period reporting methodology.
3 Total switched access lines include payphone access lines of 47 at December 31, 2011, 62 at December 31, 2010, and 80 at December 31, 2009.
4 Total wireline broadband connections include DSL, U-verse High Speed Internet and satellite broadband.
5 Satellite service includes connections under our agency and resale agreements.
6 Includes consumer U-verse VoIP connections of 2,278 at December 31, 2011, 1,680 at December 31, 2010, and 954 at December 31, 2009.