Apple 1997 Annual Report Download - page 13
Download and view the complete annual report
Please find page 13 of the 1997 Apple annual report below. You can navigate through the pages in the report by either clicking on the pages listed below, or by using the keyword search tool below to find specific information within the annual report.-
 1
1 -
2
-
 3
3 -
 4
4 -
 5
5 -
 6
6 -
 7
7 -
 8
8 -
 9
9 -
 10
10 -
 11
11 -
 12
12 -
 13
13 -
 14
14 -
 15
15 -
 16
16 -
 17
17 -
 18
18 -
 19
19 -
 20
20 -
 21
21 -
 22
22 -
 23
23 -
24
-
25
-
26
-
27
-
28
-
29
-
30
-
31
-
32
-
33
-
34
-
35
-
36
-
37
-
38
-
39
-
40
-
41
-
42
-
43
-
44
-
45
-
46
-
47
-
48
-
49
-
50
-
51
-
52
-
53
-
54
-
55
-
56
-
57
-
58
-
59
-
60
-
61
-
62
-
63
-
64
-
65
-
66
-
67
-
68
-
69
-
70
-
71
-
72
-
73
-
74
-
75
-
76
-
77
-
78
-
79
-
80
-
81
-
82
-
83
-
84
-
85
-
86
-
87
-
88
-
89
-
90
-
91
-
92
-
93
-
94
-
95
-
96
-
97
-
98
-
99
-
100
-
101
-
102
-
103
-
104
-
105
-
106
-
107
-
108
-
109
-
110
-
111
-
112
-
113
-
114
-
115
-
116
-
117
-
118
-
119
-
120
-
121
-
122
-
123
-
124
-
125
-
126
-
127
-
128
-
129
-
130
-
131
-
132
-
133
-
134
-
135
-
136
-
137
-
138
-
139
-
140
-
141
-
142
-
143
-
144
-
145
-
146
-
147
-
148
-
149
-
150
-
151
-
152
-
153
-
154
-
155
-
156
-
157
-
158
-
159
-
160
-
161
-
162
-
163
-
164
-
165
-
166
-
167
-
168
-
169
-
170
-
171
-
172
-
173
-
174
-
175
-
176
-
177
-
178
-
179
-
180
-
181
-
182
-
183
-
184
-
185
-
186
-
187
 |
 |

ability to make timely delivery to the marketplace of technological innovations, including its ability to continue to make timely delivery of
planned enhancements to the current Mac OS and to make timely delivery of a new and substantially backward-compatible operating system;
the Company's ability to successfully integrate NeXT technologies, processes and employees with those at Apple; the Company's ability to
successfully implement its strategic direction and restructuring actions, including reducing its expenditures; the Company's ability to attract,
motivate and retain employees, including a new Chief Executive Officer; the effects of significant adverse publicity; the availability of third-
party software for particular applications; and the impact on the Company's sales, market share and gross margins as a result of the Company
winding down its Mac OS licensing program.
RESULTS OF OPERATIONS
NM: Not Meaningful
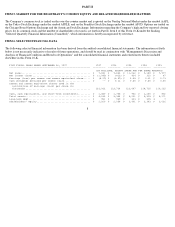
NET SALES
YEAR ENDED SEPTEMBER 26, 1997 COMPARED WITH YEAR ENDED SEPTEMBER 27, 1996
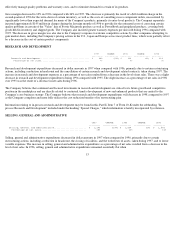
Net sales represent the Company's gross sales net of returns, rebates and discounts. Net sales decreased 28% in 1997 compared with 1996.
Total Macintosh computer unit sales and peripheral unit sales decreased 27% and 33%, respectively, during 1997, compared with 1996, as a
result of a decline in worldwide demand for most of the Company's product families, which the Company believes was due principally to
continued customer concerns regarding the Company's strategic direction, financial condition and future prospects, and the viability of the
Macintosh platform, and to competitive pressures in the marketplace. The average aggregate revenue per Macintosh unit decreased slightly in
1997 compared with 1996, primarily due to continued pricing actions, including increased rebates, across most product lines, substantially
offset by a shift in product mix toward the Company's newer and higher priced PowerBook products. The average aggregate revenue per
peripheral unit did not change in 1997 compared with 1996. For information regarding quarterly net sales, see "Selected Quarterly Financial
Information (Unaudited)" in Part II, Item 8 of this Form 10-K.
10
1997 CHANGE 1996 CHANGE 1995
--------- ----------- --------- ----------- ---------
(TABULAR INFORMATION: DOLLARS IN MILLIONS, EXCEPT PER
SHARE AMOUNTS)
Net sales................................................ $ 7,081 (28%) $ 9,833 (11%) $ 11,062
Gross margin............................................. $ 1,368 41% $ 968 (66%) $ 2,858
Percentage of net sales................................ 19% 10% 26%
Research and development................................. $ 485 (20%) $ 604 (2%) $ 614
Percentage of net sales................................ 7% 6% 6%
Selling, general and administrative...................... $ 1,286 (18%) $ 1,568 (1%) $ 1,583
Percentage of net sales................................ 18% 16% 14%
Special Charges
In-process research and development.................... $ 375 NM $ -- NM $ --
Percentage of net sales.............................. 5% --% --%
Restructuring costs.................................... $ 217 21% $ 179 NM $ (23)
Percentage of net sales.............................. 3% 2% --%
Termination of license agreement....................... $ 75 NM $ -- NM $ --
Percentage of net sales.............................. 1% --% --%
Interest and other income (expense), net................. $ 25 (72%) $ 88 NM $ (10)
Net income (loss)........................................ $ (1,045) (28%) $ (816) (292%) $ 424
Earnings (loss) per share................................ $ (8.29) (26%) $ (6.59) (291%) $ 3.45