Apple 1997 Annual Report Download - page 16
Download and view the complete annual report
Please find page 16 of the 1997 Apple annual report below. You can navigate through the pages in the report by either clicking on the pages listed below, or by using the keyword search tool below to find specific information within the annual report.-
 1
1 -
2
-
3
-
4
-
5
-
 6
6 -
 7
7 -
 8
8 -
 9
9 -
 10
10 -
 11
11 -
 12
12 -
 13
13 -
 14
14 -
 15
15 -
 16
16 -
 17
17 -
 18
18 -
 19
19 -
 20
20 -
 21
21 -
 22
22 -
 23
23 -
 24
24 -
 25
25 -
 26
26 -
27
-
28
-
29
-
30
-
31
-
32
-
33
-
34
-
35
-
36
-
37
-
38
-
39
-
40
-
41
-
42
-
43
-
44
-
45
-
46
-
47
-
48
-
49
-
50
-
51
-
52
-
53
-
54
-
55
-
56
-
57
-
58
-
59
-
60
-
61
-
62
-
63
-
64
-
65
-
66
-
67
-
68
-
69
-
70
-
71
-
72
-
73
-
74
-
75
-
76
-
77
-
78
-
79
-
80
-
81
-
82
-
83
-
84
-
85
-
86
-
87
-
88
-
89
-
90
-
91
-
92
-
93
-
94
-
95
-
96
-
97
-
98
-
99
-
100
-
101
-
102
-
103
-
104
-
105
-
106
-
107
-
108
-
109
-
110
-
111
-
112
-
113
-
114
-
115
-
116
-
117
-
118
-
119
-
120
-
121
-
122
-
123
-
124
-
125
-
126
-
127
-
128
-
129
-
130
-
131
-
132
-
133
-
134
-
135
-
136
-
137
-
138
-
139
-
140
-
141
-
142
-
143
-
144
-
145
-
146
-
147
-
148
-
149
-
150
-
151
-
152
-
153
-
154
-
155
-
156
-
157
-
158
-
159
-
160
-
161
-
162
-
163
-
164
-
165
-
166
-
167
-
168
-
169
-
170
-
171
-
172
-
173
-
174
-
175
-
176
-
177
-
178
-
179
-
180
-
181
-
182
-
183
-
184
-
185
-
186
-
187
 |
 |
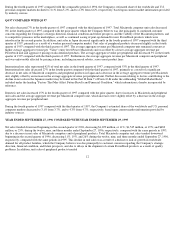
downward beginning in the second quarter of 1996, decreasing 20%, 24%, and 30% during the twelve, nine and three months ended September
27, 1996, respectively, compared with the same periods in 1995, for the reasons noted above. The average aggregate revenue per Macintosh
unit increased slightly during the twelve and three months ended September 27, 1996, and decreased slightly during the nine months ended
September 27, 1996, compared with the same periods in 1995, primarily due to a continued shift in product mix toward the Company's newer
products and products with multimedia configurations, offset to varying degrees by pricing actions across all product lines. The average
aggregate revenue per peripheral product was flat during the twelve, nine, and three months ended September 27, 1996 compared with the same
periods in 1995.
International net sales represented 52% of net sales in 1996 compared with 48% of net sales in 1995. International net sales trended downward
beginning in the second quarter of 1996, decreasing 3%, 11% and 13% during the twelve, nine, and three months ended September 27, 1996,
respectively, compared with the same periods in 1995. Net sales in European markets trended downward beginning in the second quarter of
1996, decreasing during the twelve, nine, and three months ended September 27, 1996 compared with the same periods in 1995, as a result of a
decrease in Macintosh and peripheral unit sales, partially offset by an increase in the average aggregate revenue per Macintosh and per
peripheral unit, primarily during the first part of the year. Net sales in Japan trended downward beginning in the second quarter of 1996,
decreasing during the twelve, nine, and three months ended September 27, 1996 compared with the same periods in 1995. An increase in
Macintosh unit sales during these periods was more than offset by a decrease in the average aggregate revenue per Macintosh and per
peripheral unit and a decrease in peripheral unit sales. Domestic net sales trended downward beginning in the second quarter of 1996,
decreasing by 18%, 26%, and 30% for the twelve, nine, and three months ended September 27, 1996, respectively, compared with the
corresponding periods in 1995, resulting from a decline or lack of growth in demand for all product families.
In the fourth quarter of 1996 compared with the fourth quarter of 1995, the Company's share of the worldwide and U.S. personal computer
markets declined to 5.4% from 8.7%, and to 7.3% from 13.2%, respectively, based on current information provided by industry sources.
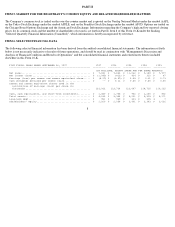
BACKLOG
In general, the Company's resellers purchase products on an as-needed basis. Resellers frequently change delivery schedules and order rates
depending on changing market conditions. Unfilled orders (backlog) can be, and often are, canceled at will. The Company attempts to fill
orders on the requested delivery schedules. However, products may be in relatively short supply from time to time until production volumes
have reached a level sufficient to meet demand or if other production or fulfillment constraints exist. The Company's backlog of unfilled orders
decreased to approximately $230 million at November 28, 1997 from approximately $563 million at November 29, 1996 and consisted
primarily of the Company's "Flagship" line of higher-end Power Macintosh products. The Company's backlog at November 29, 1996 consisted
primarily of the Company's PowerBook products, as well as the Company's "Flagship" line of higher-end Power Macintosh products. The
Company expects that substantially all of its orders in backlog at November 28, 1997 will be either shipped or canceled during fiscal 1998.
In the Company's experience, the actual amount of product backlog at any particular time is not a meaningful indication of its future business
prospects. In particular, backlog often increases in anticipation of or immediately following introduction of new products because of
overordering by dealers anticipating shortages. Backlog often is reduced once dealers and customers believe they can obtain sufficient supply.
Because of the foregoing, as well as other factors affecting the Company's backlog, backlog should not be considered a reliable indicator of the
Company's ability to achieve any particular level of revenue or financial performance. Further information regarding the Company's backlog
may be found in Part II, Item 7 of this Form 10-K under the subheading "Product Introductions and Transitions" included under
13