Apple 1997 Annual Report Download - page 61
Download and view the complete annual report
Please find page 61 of the 1997 Apple annual report below. You can navigate through the pages in the report by either clicking on the pages listed below, or by using the keyword search tool below to find specific information within the annual report.-
 1
1 -
2
-
3
-
4
-
5
-
6
-
7
-
8
-
9
-
10
-
11
-
12
-
13
-
14
-
15
-
16
-
17
-
18
-
19
-
20
-
21
-
22
-
23
-
24
-
25
-
26
-
27
-
28
-
29
-
30
-
31
-
32
-
33
-
34
-
35
-
36
-
37
-
38
-
39
-
40
-
41
-
42
-
43
-
44
-
45
-
46
-
47
-
48
-
49
-
50
-
 51
51 -
 52
52 -
 53
53 -
 54
54 -
 55
55 -
 56
56 -
 57
57 -
 58
58 -
 59
59 -
 60
60 -
 61
61 -
 62
62 -
 63
63 -
 64
64 -
 65
65 -
 66
66 -
 67
67 -
 68
68 -
 69
69 -
 70
70 -
 71
71 -
72
-
73
-
74
-
75
-
76
-
77
-
78
-
79
-
80
-
81
-
82
-
83
-
84
-
85
-
86
-
87
-
88
-
89
-
90
-
91
-
92
-
93
-
94
-
95
-
96
-
97
-
98
-
99
-
100
-
101
-
102
-
103
-
104
-
105
-
106
-
107
-
108
-
109
-
110
-
111
-
112
-
113
-
114
-
115
-
116
-
117
-
118
-
119
-
120
-
121
-
122
-
123
-
124
-
125
-
126
-
127
-
128
-
129
-
130
-
131
-
132
-
133
-
134
-
135
-
136
-
137
-
138
-
139
-
140
-
141
-
142
-
143
-
144
-
145
-
146
-
147
-
148
-
149
-
150
-
151
-
152
-
153
-
154
-
155
-
156
-
157
-
158
-
159
-
160
-
161
-
162
-
163
-
164
-
165
-
166
-
167
-
168
-
169
-
170
-
171
-
172
-
173
-
174
-
175
-
176
-
177
-
178
-
179
-
180
-
181
-
182
-
183
-
184
-
185
-
186
-
187
 |
 |
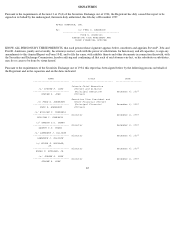
SELECTED QUARTERLY FINANCIAL INFORMATION (UNAUDITED)
As of September 26, 1997, there were 31,724 shareholders of record.
The Company began declaring quarterly cash dividends on its common stock in April 1987. The dividend policy is determined by the Board of
Directors and is dependent on the Company's earnings, capital requirements, financial condition and other factors. The Company suspended
paying dividends on its common stock beginning in the second quarter of 1996. The Company anticipates that, for the foreseeable future, it will
retain any earnings for use in the operation of its business.
The price range per common share represents the highest and lowest prices for the Company's common stock on the Nasdaq National Market
during each quarter.
Net loss for the fourth quarter of 1997 includes a $62 million charge to increase the Company's restructuring reserves, as well as a $75 million
charge related to the termination of the license agreement with PCC. Net loss for the second quarter of 1997 includes a $155 million
restructuring charge, as well as a $375 million write-off of purchased in-
process research and development related to the Company's acquisition
of NeXT Software, Inc.
Net income for the fourth quarter of 1996 includes an adjustment to the 1996 restructuring charge that increased income by $28 million. Net
loss for the second quarter of 1996 includes a $616 million charge for the write-
down of certain inventory and related actions, as well as a $207
million restructuring charge.
58
FOURTH QUARTER THIRD QUARTER SECOND QUARTER FIRST QUARTER
--------------- --------------- --------------- ---------------
(TABULAR AMOUNTS IN MILLIONS, EXCEPT PER SHARE AMOUNTS)
1997
Net sales................................... $ 1,614 $ 1,737 $ 1,601 $ 2,129
Gross margin................................ $ 320 $ 348 $ 303 $ 397
Net loss.................................... $ (161) $ (56) $ (708) $ (120)
Loss per common share....................... $ (1.26) $ (0.44) $ (5.64) $ (0.96)
Price range per common share................ $ 29.75-$12.75 $ 19.88-$14.63 $ 23.25-$15.12 $ 27.75-$21.38
1996
Net sales................................... $ 2,321 $ 2,179 $ 2,185 $ 3,148
Gross margin................................ $ 511 $ 403 $ (421) $ 475
Net income (loss)........................... $ 25 $ (32) $ (740) $ (69)
Earnings (loss) per common and common
equivalent share.......................... $ 0.20 $ (0.26) $ (5.99) $ (0.56)
Cash dividends declared per common share.... $ -- $ -- $ -- $ 0.12
Price range per common share................ $ 25.00-$16.00 $ 28.88-$19.63 $ 35.50-$23.00 $ 42.50-$31.44