Apple 2004 Annual Report Download - page 75
Download and view the complete annual report
Please find page 75 of the 2004 Apple annual report below. You can navigate through the pages in the report by either clicking on the pages listed below, or by using the keyword search tool below to find specific information within the annual report.-
 1
1 -
2
-
3
-
4
-
5
-
6
-
7
-
8
-
9
-
10
-
11
-
12
-
13
-
14
-
15
-
16
-
17
-
18
-
19
-
20
-
21
-
22
-
23
-
24
-
25
-
26
-
27
-
28
-
29
-
30
-
31
-
32
-
33
-
34
-
35
-
36
-
37
-
38
-
39
-
40
-
41
-
42
-
43
-
44
-
45
-
46
-
47
-
48
-
49
-
50
-
51
-
52
-
53
-
54
-
55
-
56
-
57
-
58
-
59
-
60
-
61
-
62
-
63
-
64
-
 65
65 -
 66
66 -
 67
67 -
 68
68 -
 69
69 -
 70
70 -
 71
71 -
 72
72 -
 73
73 -
 74
74 -
 75
75 -
 76
76 -
 77
77 -
 78
78 -
 79
79 -
 80
80 -
 81
81 -
 82
82 -
 83
83 -
 84
84 -
 85
85 -
86
-
87
-
88
-
89
-
90
-
91
-
92
-
93
-
94
-
95
-
96
-
97
-
98
-
99
-
100
-
101
-
102
-
103
-
104
-
105
-
106
-
107
-
108
-
109
-
110
-
111
-
112
-
113
-
114
-
115
-
116
-
117
-
118
-
119
-
120
-
121
-
122
-
123
-
124
-
125
-
126
-
127
-
128
-
129
-
130
-
131
-
132
 |
 |

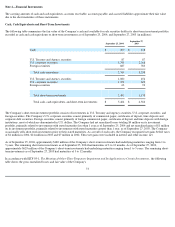
stock purchase plan shares have characteristics significantly different from those of freely traded options, and because changes in the subjective
input assumptions can materially affect the fair value estimate, in management's opinion, the existing models do not provide a reliable measure
of the fair value of the Company's employee stock options and employee stock purchase plan shares.
For purposes of pro forma disclosures, the estimated fair value of the options and shares is amortized to pro forma net income (loss) over the
options' vesting period and the shares' plan period. The Company's pro forma information for each of the last three fiscal years follows (in
millions, except per share amounts):
Earnings Per Common Share
Basic earnings per common share is computed by dividing income available to common shareholders by the weighted-average number of shares
of common stock outstanding during the period. Diluted earnings per common share is computed by dividing income available to common
shareholders by the weighted-average number of shares of common stock outstanding during the period increased to include the number of
additional shares of common stock that would have been outstanding if the dilutive potential shares of common stock had been issued. The
dilutive effect of outstanding options, restricted stock and restricted stock units is reflected in diluted earnings per share by application of the
treasury stock method. Under the treasury stock method, an increase in the fair market value of the Company's common stock can result in a
greater dilutive effect from outstanding options, restricted stock and restricted stock units. Additionally, the exercise of employee stock options
and the vesting of restricted stock and restricted stock units can result in a greater dilutive effect on earnings per share.
71
2004
2003
2002
Net income
—
as reported
$
276
$
69
$
65
Add: Stock-based employee compensation expense included in reported
net income, net of tax
33
15
5
Deduct: Stock-based employee compensation expense determined under
the fair value based method for all awards, net of tax
(141
)
(181
)
(234
)
Net income (loss)
—
pro forma
$
168
$
(97
)
$
(164
)
Net income per common share
—
as reported
Basic
$
0.74
$
0.19
$
0.18
Diluted
$
0.71
$
0.19
$
0.18
Net income (loss) per common share
—
pro forma
Basic
$
0.45
$
(0.27
)
$
(0.46
)
Diluted
$
0.44
$
(0.27
)
$
(0.46
)