Apple 2004 Annual Report Download - page 83
Download and view the complete annual report
Please find page 83 of the 2004 Apple annual report below. You can navigate through the pages in the report by either clicking on the pages listed below, or by using the keyword search tool below to find specific information within the annual report.-
 1
1 -
2
-
3
-
4
-
5
-
6
-
7
-
8
-
9
-
10
-
11
-
12
-
13
-
14
-
15
-
16
-
17
-
18
-
19
-
20
-
21
-
22
-
23
-
24
-
25
-
26
-
27
-
28
-
29
-
30
-
31
-
32
-
33
-
34
-
35
-
36
-
37
-
38
-
39
-
40
-
41
-
42
-
43
-
44
-
45
-
46
-
47
-
48
-
49
-
50
-
51
-
52
-
53
-
54
-
55
-
56
-
57
-
58
-
59
-
60
-
61
-
62
-
63
-
64
-
65
-
66
-
67
-
68
-
69
-
70
-
71
-
72
-
 73
73 -
 74
74 -
 75
75 -
 76
76 -
 77
77 -
 78
78 -
 79
79 -
 80
80 -
 81
81 -
 82
82 -
 83
83 -
 84
84 -
 85
85 -
 86
86 -
 87
87 -
 88
88 -
 89
89 -
 90
90 -
 91
91 -
 92
92 -
 93
93 -
94
-
95
-
96
-
97
-
98
-
99
-
100
-
101
-
102
-
103
-
104
-
105
-
106
-
107
-
108
-
109
-
110
-
111
-
112
-
113
-
114
-
115
-
116
-
117
-
118
-
119
-
120
-
121
-
122
-
123
-
124
-
125
-
126
-
127
-
128
-
129
-
130
-
131
-
132
 |
 |

ARM
ARM is a publicly held company in the U.K. involved in the design and licensing of high performance microprocessors and related technology.
During the third quarter of 2003, the Company sold all of its remaining holdings in ARM stock, consisting of 278,000 shares for net proceeds of
approximately $295,000, and a gain before taxes of $270,000.
During the first quarter of 2002, the Company sold 4.7 million shares of ARM stock for both net proceeds and a gain before taxes of $21 million.
No sales of ARM were made in any of the subsequent quarters of fiscal 2002.
Other Strategic Investments
The Company has made additional minority debt and equity investments in several privately held technology companies, which were reflected in
the consolidated balance sheets in other assets. These investments were inherently risky because the products and/or markets of these companies
were typically not fully developed. During 2002, the Company determined the decline in fair value of certain of these investments was other-
than-temporary and, accordingly, recognized a charge to earnings of $15 million. These charges were included in gains (losses) on non-current
investments, net. As of September 25, 2004, the Company had $1.4 million of equity investments reflected in its consolidated balance sheet. As
of September 27, 2003, the Company had no private debt or equity investments reflected in its consolidated balance sheet.
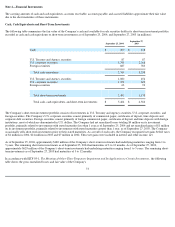
Note 3—Consolidated Financial Statement Details (in millions)
Inventories
Other Current Assets
79
2004
2003
Purchased parts
$
1
$
2
Work in process
—
4
Finished goods
100
50
Total inventories
$
101
$
56
2004
2003
Vendor non
-
trade receivables
$
276
$
184
Other current assets
209
125
Total other current assets
$
485
$
309