Apple 2009 Annual Report Download - page 44
Download and view the complete annual report
Please find page 44 of the 2009 Apple annual report below. You can navigate through the pages in the report by either clicking on the pages listed below, or by using the keyword search tool below to find specific information within the annual report.-
 1
1 -
2
-
3
-
4
-
5
-
6
-
7
-
8
-
9
-
10
-
11
-
12
-
13
-
14
-
15
-
16
-
17
-
18
-
19
-
20
-
21
-
22
-
23
-
24
-
25
-
26
-
27
-
28
-
29
-
30
-
31
-
32
-
33
-
 34
34 -
 35
35 -
 36
36 -
 37
37 -
 38
38 -
 39
39 -
 40
40 -
 41
41 -
 42
42 -
 43
43 -
 44
44 -
 45
45 -
 46
46 -
 47
47 -
 48
48 -
 49
49 -
 50
50 -
 51
51 -
 52
52 -
 53
53 -
 54
54 -
55
-
56
-
57
-
58
-
59
-
60
-
61
-
62
-
63
-
64
-
65
-
66
-
67
-
68
-
69
-
70
-
71
-
72
-
73
-
74
-
75
-
76
-
77
-
78
-
79
-
80
-
81
-
82
-
83
-
84
-
85
-
86
-
87
-
88
-
89
-
90
-
91
-
92
-
93
-
94
-
95
-
96
-
97
-
98
-
99
-
100
-
101
-
102
-
103
-
104
-
105
-
106
 |
 |

Table of Contents
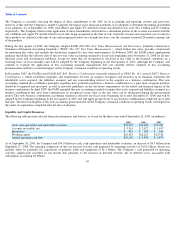
The following table summarizes net sales and Mac unit sales by operating segment and net sales and unit sales by product during the three years
ended September 26, 2009 (in millions, except unit sales in thousands and per unit amounts):
41
2009
Change
2008
Change
2007
Net Sales by Operating Segment:
Americas net sales
$
16,142
11%
$
14,573
26%
$
11,596
Europe net sales
9,365
23%
7,622
40%
5,460
Japan net sales
1,831
21%
1,509
39%
1,082
Retail net sales
6,574
4%
6,315
53%
4,115
Other Segments net sales (a)
2,625
7%
2,460
40%
1,753
Total net sales
$
36,537
12%
$
32,479
35%
$
24,006
Mac Unit Sales by Operating Segment:
Americas Mac unit sales
4,120
4%
3,980
32%
3,019
Europe Mac unit sales
2,840
13%
2,519
39%
1,816
Japan Mac unit sales
395
2%
389
29%
302
Retail Mac unit sales
2,115
4%
2,034
47%
1,386
Other Segments Mac unit sales (a)
926
17%
793
50%
528
Total Mac unit sales
10,396
7%
9,715
38%
7,051
Net Sales by Product:
Desktops (b)
$
4,308
(23)%
$
5,603
39%
$
4,020
Portables (c)
9,472
9%
8,673
38%
6,294
Total Mac net sales
13,780
(3)%
14,276
38%
10,314
iPod
8,091
(12)%
9,153
10%
8,305
Other music related products and services (d)
4,036
21%
3,340
34%
2,496
iPhone and related products and services (e)
6,754
266%
1,844
NM
123
Peripherals and other hardware (f)
1,470
(11)%
1,659
32%
1,260
Software, service and other sales (g)
2,406
9%
2,207
46%
1,508
Total net sales
$
36,537
12%
$
32,479
35%
$
24,006
Unit Sales by Product:
Desktops (b)
3,182
(14)%
3,712
37%
2,714
Portables (c)
7,214
20%
6,003
38%
4,337
Total Mac unit sales
10,396
7%
9,715
38%
7,051
Net sales per Mac unit sold (h)
$
1,326
(10)%
$
1,469
—
%
$
1,463
iPod unit sales
54,132
(1)%
54,828
6%
51,630
Net sales per iPod unit sold (i)
$
149
(11)%
$
167
4%
$
161
iPhone unit sales
20,731
78%
11,627
NM
1,389
(a)
Other Segments include Asia Pacific and FileMaker.
(b)
Includes iMac, Mac mini, Mac Pro and Xserve product lines.
(c)
Includes MacBook, MacBook Air and MacBook Pro product lines.
(d)
Consists of iTunes Store sales, iPod services, and Apple
-
branded and third
-
party iPod accessories.
(e)
Derived from handset sales, carrier agreements, and Apple
-
branded and third
-
party iPhone accessories.
(f)
Includes sales of displays, wireless connectivity and networking solutions, and other hardware accessories.