Apple 2009 Annual Report Download - page 70
Download and view the complete annual report
Please find page 70 of the 2009 Apple annual report below. You can navigate through the pages in the report by either clicking on the pages listed below, or by using the keyword search tool below to find specific information within the annual report.-
 1
1 -
2
-
3
-
4
-
5
-
6
-
7
-
8
-
9
-
10
-
11
-
12
-
13
-
14
-
15
-
16
-
17
-
18
-
19
-
20
-
21
-
22
-
23
-
24
-
25
-
26
-
27
-
28
-
29
-
30
-
31
-
32
-
33
-
34
-
35
-
36
-
37
-
38
-
39
-
40
-
41
-
42
-
43
-
44
-
45
-
46
-
47
-
48
-
49
-
50
-
51
-
52
-
53
-
54
-
55
-
56
-
57
-
58
-
59
-
 60
60 -
 61
61 -
 62
62 -
 63
63 -
 64
64 -
 65
65 -
 66
66 -
 67
67 -
 68
68 -
 69
69 -
 70
70 -
 71
71 -
 72
72 -
 73
73 -
 74
74 -
 75
75 -
 76
76 -
 77
77 -
 78
78 -
 79
79 -
 80
80 -
81
-
82
-
83
-
84
-
85
-
86
-
87
-
88
-
89
-
90
-
91
-
92
-
93
-
94
-
95
-
96
-
97
-
98
-
99
-
100
-
101
-
102
-
103
-
104
-
105
-
106
 |
 |
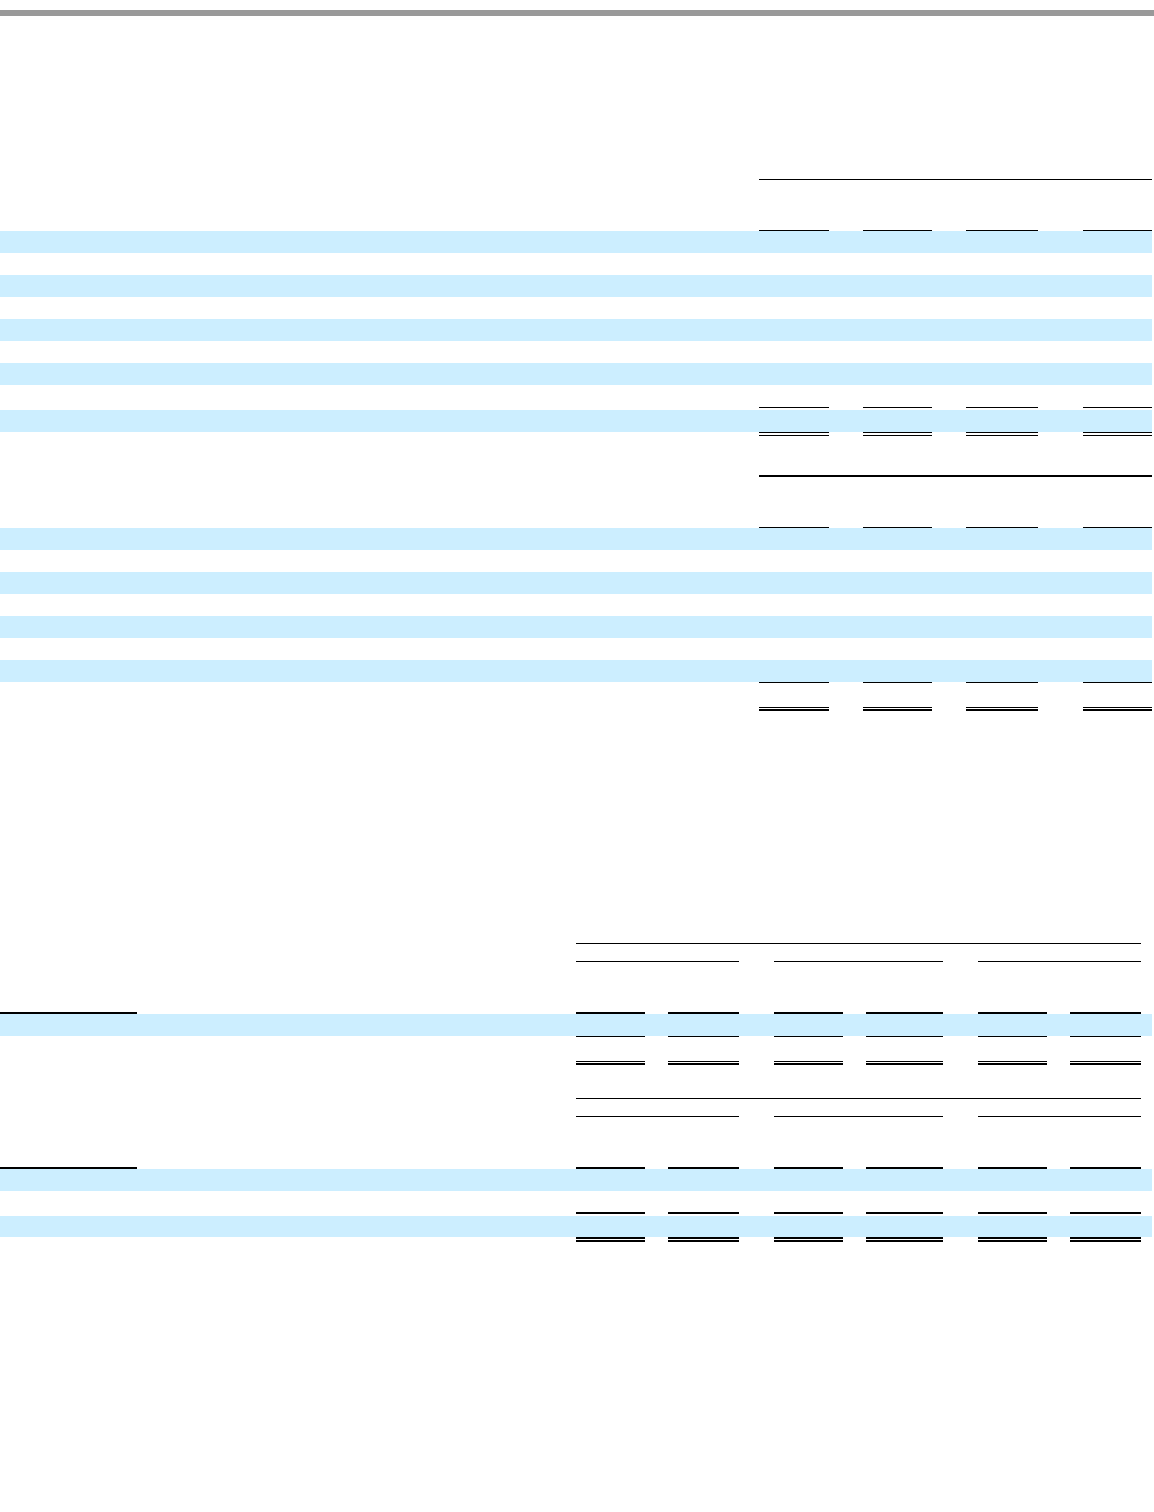
Table of Contents
The following tables summarize the Company’s available-for-sale securities’
adjusted cost, gross unrealized gains, gross unrealized losses and
fair value by significant investment category as of September 26, 2009 and September 27, 2008 (in millions):
The Company had net unrealized gains on its investment portfolio of $57 million as of September 26, 2009 and net unrealized losses on its
investment portfolio of $117 million as of September 27, 2008. The net unrealized gains as of September 26, 2009 and the net unrealized losses
as of September 27, 2008 related primarily to long-
term marketable securities. The Company may sell certain of its marketable securities prior to
their stated maturities for strategic purposes, in anticipation of credit deterioration, or for duration management. The Company recognized no
material net gains or losses during 2009, 2008 and 2007 related to such sales.
The following table shows the gross unrealized losses and fair value for investments in an unrealized loss position as of September 26, 2009 and
September 27, 2008, aggregated by investment category and the length of time that individual securities have been in a continuous loss position
(in millions):
67
September 26, 2009
Adjusted
Cost
Unrealized
Gains
Unrealized
Losses
Fair
Value
Money market funds
$
1,608
$
—
$
—
$
1,608
U.S. Treasury securities
3,610
6
—
3,616
U.S. agency securities
11,085
22
—
11,107
Non
-
U.S. government securities
320
1
—
321
Certificates of deposit and time deposits
1,714
—
—
1,714
Commercial paper
4,197
—
—
4,197
Corporate securities
9,760
42
(16
)
9,786
Municipal securities
502
2
—
504
Total cash equivalents and marketable securities
$
32,796
$
73
$
(16
)
$
32,853
September 27, 2008
Adjusted
Cost
Unrealized
Gains
Unrealized
Losses
Fair
Value
Money market funds
$
1,536
$
—
$
—
$
1,536
U.S. Treasury securities
559
2
—
561
U.S. agency securities
9,383
2
(13
)
9,372
Non
-
U.S. government securities
83
—
—
83
Certificates of deposit and time deposits
3,078
—
—
3,078
Commercial paper
5,683
—
—
5,683
Corporate securities
3,917
—
(
108
)
3,809
Total cash equivalents and marketable securities
$
24,239
$
4
$
(121
)
$
24,122
September 26, 2009
Less than 12 Months
12 Months or Greater
Total
Security Description
Fair
Value
Unrealized
Losses
Fair
Value
Unrealized
Losses
Fair
Value
Unrealized
Loss
Corporate securities
$
1,667
$
(3
)
$
719
$ (13)
$ 2,386
$
(16
)
Total
$
1,667
$
(3
)
$
719
$ (13)
$ 2,386
$
(16
)
September 27, 2008
Less than 12 Months
12 Months or Greater
Total
Security Description
Fair
Value
Unrealized
Losses
Fair
Value
Unrealized
Losses
Fair
Value
Unrealized
Loss
U.S. agency securities
$
6,822
$
(13
)
$
—
$
—
$
6,822
$
(13
)
Corporate securities
2,147
(31
)
1,148
(77
)
3,295
(108
)
Total
$
8,969
$
(44
)
$
1,148
$ (77
)
$ 10,117
$
(121
)