Apple 2009 Annual Report Download - page 45
Download and view the complete annual report
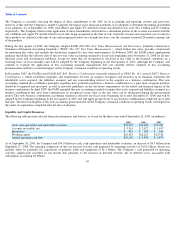
Please find page 45 of the 2009 Apple annual report below. You can navigate through the pages in the report by either clicking on the pages listed below, or by using the keyword search tool below to find specific information within the annual report.-
 1
1 -
2
-
3
-
4
-
5
-
6
-
7
-
8
-
9
-
10
-
11
-
12
-
13
-
14
-
15
-
16
-
17
-
18
-
19
-
20
-
21
-
22
-
23
-
24
-
25
-
26
-
27
-
28
-
29
-
30
-
31
-
32
-
33
-
34
-
 35
35 -
 36
36 -
 37
37 -
 38
38 -
 39
39 -
 40
40 -
 41
41 -
 42
42 -
 43
43 -
 44
44 -
 45
45 -
 46
46 -
 47
47 -
 48
48 -
 49
49 -
 50
50 -
 51
51 -
 52
52 -
 53
53 -
 54
54 -
 55
55 -
56
-
57
-
58
-
59
-
60
-
61
-
62
-
63
-
64
-
65
-
66
-
67
-
68
-
69
-
70
-
71
-
72
-
73
-
74
-
75
-
76
-
77
-
78
-
79
-
80
-
81
-
82
-
83
-
84
-
85
-
86
-
87
-
88
-
89
-
90
-
91
-
92
-
93
-
94
-
95
-
96
-
97
-
98
-
99
-
100
-
101
-
102
-
103
-
104
-
105
-
106
 |
 |

Table of Contents
NM = Not Meaningful
Fiscal Year 2009 versus 2008
Net sales during 2009 increased $4.1 billion or 12% compared to 2008. Several factors contributed positively to these increases, including the
following:
Partially offsetting the favorable factors discussed above, net sales during 2009 were negatively impacted by certain factors, including the
following:
42
(g)
Includes sales of Apple
-
branded operating system and application software, third
-
party software, AppleCare and Internet services.
(h)
Derived by dividing total Mac net sales by total Mac unit sales.
(i)
Derived by dividing total iPod net sales by total iPod unit sales.
•
iPhone revenue and net sales of related products and services amounted to $6.8 billion in 2009, an increase of $4.9 billion or 266%
compared to 2008. iPhone handset unit sales totaled 20.7 million during 2009, which represents an increase of 9.1 million or 78%
during 2009 compared to 2008. This growth is attributed primarily to expanded distribution and strong overall demand for iPhones.
iPhone 3GS was released in the U.S. on June 19, 2009 and in many other countries over the remainder of 2009. iPhone revenue
includes the portion of handset revenue recognized in the relevant period in accordance with subscription accounting over the
product’s currently estimated 24-
month economic life, as well as revenue from sales of iPhone accessories and carrier agreements.
The year-over-year iPhone revenue growth is also largely attributable to the year-over-
year increase in iPhone handset unit sales in
both 2009 and 2008, which generated significant amounts of deferred revenue that is being recognized over the iPhone’
s estimated
economic life.
•
Net sales of other music
-
related products and services increased $696 million or 21% during 2009 compared to 2008. The increase
was due predominantly to increased net sales of third-
party digital content and applications from the iTunes Store, which experienced
double-digit growth in each of the Company’
s geographic segments during 2009 compared to the same period in 2008. The
Company believes this continued growth is the result of heightened consumer interest in downloading third-
party digital content and
applications, continued growth in its customer base of iPod and iPhone customers, the expansion of third-
party audio and video
content available for sale and rent via the iTunes Store, and the continued interest in and growth of the App Store. The Company
continues to expand its iTunes content and applications offerings around the world.
•
Mac net sales declined 3% during 2009 compared to 2008, although Mac unit sales increased by 7% over the same period. Net sales
per Mac unit sold decreased by 10% during 2009 compared to 2008, due primarily to lower average selling prices across all Mac
portable and desktop systems and a stronger U.S. dollar. Net sales of Macs accounted for 38% of the Company’
s total net sales for
2009. During 2009, Mac portable systems net sales and unit sales increased by 9% and 20%, respectively, compared to 2008. This
growth was driven by strong demand for MacBook Pro, which was updated in June 2009 and October 2008, and experienced double
digit net sales and unit growth in each of the Company’
s reportable operating segments compared to the same period in 2008. The
Company also had a higher product mix of portable systems, which is consistent with the overall market trends. However, net sales
and unit sales of the Company’
s Mac desktop systems decreased by 23% and 14%, respectively, during 2009 compared to 2008. The
decrease in net sales of Mac desktop systems was due mainly to a shift in product mix towards lower-
priced desktops, lower average
selling prices across all Mac desktop systems and a stronger U.S. dollar.
•
Net sales of iPods decreased $1.1 billion or 12% during 2009 compared to 2008. iPod unit sales decreased slightly by 1% during
2009 compared to 2008. Net sales per iPod unit sold decreased 11% to $149 in 2009 compared to 2008, resulting from lower average
selling prices across all of the iPod product lines, which were due primarily to price reductions taken with the introduction of new
iPods in