Apple 2009 Annual Report Download - page 49
Download and view the complete annual report
Please find page 49 of the 2009 Apple annual report below. You can navigate through the pages in the report by either clicking on the pages listed below, or by using the keyword search tool below to find specific information within the annual report.-
 1
1 -
2
-
3
-
4
-
5
-
6
-
7
-
8
-
9
-
10
-
11
-
12
-
13
-
14
-
15
-
16
-
17
-
18
-
19
-
20
-
21
-
22
-
23
-
24
-
25
-
26
-
27
-
28
-
29
-
30
-
31
-
32
-
33
-
34
-
35
-
36
-
37
-
38
-
 39
39 -
 40
40 -
 41
41 -
 42
42 -
 43
43 -
 44
44 -
 45
45 -
 46
46 -
 47
47 -
 48
48 -
 49
49 -
 50
50 -
 51
51 -
 52
52 -
 53
53 -
 54
54 -
 55
55 -
 56
56 -
 57
57 -
 58
58 -
 59
59 -
60
-
61
-
62
-
63
-
64
-
65
-
66
-
67
-
68
-
69
-
70
-
71
-
72
-
73
-
74
-
75
-
76
-
77
-
78
-
79
-
80
-
81
-
82
-
83
-
84
-
85
-
86
-
87
-
88
-
89
-
90
-
91
-
92
-
93
-
94
-
95
-
96
-
97
-
98
-
99
-
100
-
101
-
102
-
103
-
104
-
105
-
106
 |
 |

Table of Contents
iPods, the iMac, and content from the iTunes Store in the Company’s Asia Pacific region. Sales from the iTunes Store in the Company’
s Asia
Pacific region grew 109% compared to 2007.
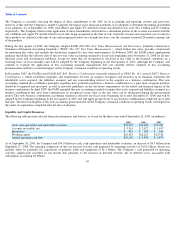
Gross Margin
Gross margin for the three years ended September 26, 2009, are as follows (in millions, except gross margin percentages):
The gross margin percentage in 2009 was 36.0% compared to 34.3% in 2008. The primary drivers of the increase in 2009 as compared to 2008
were significantly lower commodity and other product costs and a favorable sales mix toward products with higher gross margins, which were
partially offset by product price reductions. Gross margin percentage was relatively flat in 2008 as compared to 2007.
The Company expects its gross margin percentage to decrease in future periods compared to levels achieved during 2009 and anticipates gross
margin levels of about 34% in the first quarter of 2010. This expected decline is due largely to the anticipated impact of product transitions, flat
or reduced pricing on new and innovative products that have higher cost structures, and both expected and potential future cost increases for key
components.
The foregoing statements regarding the Company’s expected gross margin percentage are forward-
looking and could differ from anticipated
levels because of several factors, including but not limited to certain of those set forth below in Part I, Item 1A, “Risk Factors”
under the
subheading “ Future operating results depend upon the Company’
s ability to obtain key components including but not limited to
microprocessors, NAND flash memory, DRAM and LCDs at favorable prices and in sufficient quantities ,”
which is incorporated herein by
reference. There can be no assurance that targeted gross margin percentage levels will be achieved. In general, gross margins and margins on
individual products will remain under downward pressure due to a variety of factors, including continued industry wide global product pricing
pressures, increased competition, compressed product life cycles, product transitions and expected increases in the cost of key components
including but not limited to microprocessors, NAND flash memory, dynamic random access memory (“DRAM”)
and liquid crystal displays
(“LCDs”), as well as potential increases in the costs of outside manufacturing services and a potential shift in the Company’
s sales mix towards
products with lower gross margins. In response to these competitive pressures, the Company expects it will continue to take product pricing
actions, which would adversely affect gross margins. Gross margins could also be affected by the Company’
s ability to manage product quality
and warranty costs effectively and to stimulate demand for certain of its products. Due to the Company’
s significant international operations,
financial results can be significantly affected in the short-term by fluctuations in exchange rates.
Operating Expenses
Operating expenses for the three years ended September 26, 2009, are as follows (in millions, except for percentages):
46
2009
2008
2007
Net sales
$
36,537
$
32,479
$
24,006
Cost of sales
23,397
21,334
15,852
Gross margin
$
13,140
$
11,145
$
8,154
Gross margin percentage
36.0%
34.3%
34.0%
2009
2008
2007
Research and development
$
1,333
$
1,109
$
782
Percentage of net sales
3.6%
3.4%
3.3%
Selling, general and administrative
$
4,149
$
3,761
$
2,963
Percentage of net sales
11.4%
11.6%
12.3%