Bank of America 1998 Annual Report Download - page 9
Download and view the complete annual report
Please find page 9 of the 1998 Bank of America annual report below. You can navigate through the pages in the report by either clicking on the pages listed below, or by using the keyword search tool below to find specific information within the annual report.-
 1
1 -
 2
2 -
 3
3 -
 4
4 -
 5
5 -
 6
6 -
 7
7 -
 8
8 -
 9
9 -
 10
10 -
 11
11 -
 12
12 -
 13
13 -
 14
14 -
 15
15 -
 16
16 -
 17
17 -
 18
18 -
 19
19 -
 20
20 -
21
-
22
-
23
-
24
-
25
-
26
-
27
-
28
-
29
-
30
-
31
 |
 |

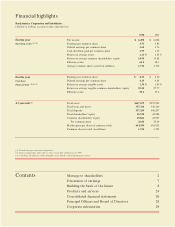
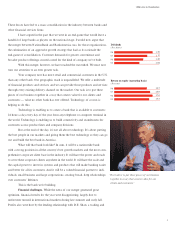
7
BankAmerica’s operating earnings
totaled $6.49 billion, or $3.73 per share,
in 1998 compared to $6.81 billion, or
$3.86 per share, in 1997. Solid gains
in the company’s core consumer and
commercial banking businesses were
offset by the impact of higher provision
expense and weaker trading revenues
resulting from turbulence in financial
markets.
Including charges related to mergers,
net income in 1998 was $5.17 billion,
or $2.97 per share, compared to
$6.54 billion, or $3.71 per share, a
year earlier.
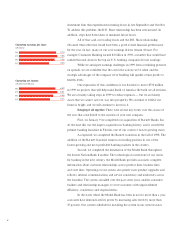
Taxable-equivalent net interest
income declined less than 1 percent to
$18.46 billion, as an 8 percent increase
in managed loans was offset by a
31-basis-point reduction in the
company’s net yield on earning assets.
Noninterest income rose 4 percent to
$12.19 billion. Investment banking,
which includes results from
NationsBanc Montgomery Securities
and Robertson Stephens acquired late
in 1997, credit card and brokerage
registered significant year-over-year
gains. These gains were partially offset
by lower trading results.
Noninterest expense increased
6 percent, reflecting the purchase of
NationsBanc Montgomery Securities
on October 1, 1997 and Robertson
Stephens, acquired that same date but
sold in the third quarter of 1998, and
spending on transition projects.
Operating earnings reach $6.5 billion in 1998.
The provision for credit losses was
$2.92 billion, up from $1.90 billion
a year earlier due largely to losses
associated with the company’s lending
relationship to D.E. Shaw, a trading
and investment firm. Net charge-offs
rose to $2.47 billion, equal to an
annualized .71 percent of average net
loans and leases, from $1.85 billion,
or .54 percent, a year earlier.
Nonperforming assets were
$2.76 billion, or .77 percent of net
loans, leases and foreclosed properties
on December 31, 1998, up from
$2.42 billion, or .71 percent a year
earlier. The allowance for credit losses
totaled $7.12 billion on December 31,
1998, equal to 287 percent of nonper-
forming loans and 1.99 percent of
loans and leases. The allowance was
$6.78 billion, or 1.98 percent of loans
and leases, a year earlier.
Total shareholders’ equity was
$45.9 billion at December 31, 1998.
This represented 7.44 percent of
period-end assets, compared to
7.81 percent on December 31, 1997.
Book value per common share rose
4 percent to $26.60 at December 31,
1998, from a year earlier.
Total assets stood at $618 billion
on December 31, 1998.