Bank of America 1999 Annual Report Download - page 3
Download and view the complete annual report
Please find page 3 of the 1999 Bank of America annual report below. You can navigate through the pages in the report by either clicking on the pages listed below, or by using the keyword search tool below to find specific information within the annual report.-
 1
1 -
 2
2 -
 3
3 -
 4
4 -
 5
5 -
 6
6 -
 7
7 -
 8
8 -
 9
9 -
 10
10 -
 11
11 -
 12
12 -
 13
13 -
 14
14 -
15
-
16
-
17
-
18
-
19
-
20
-
21
-
22
-
23
-
24
-
25
-
26
-
27
-
28
-
29
-
30
-
31
-
32
-
33
-
34
-
35
 |
 |

1
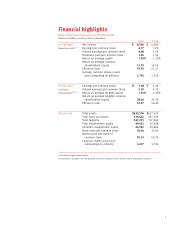
Financial highlights
Bank of America Corporation and Subsidiaries
(Dollars in millions, except per share information)
1999 1998
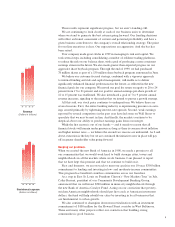
For the year Net income $$8,240 $6,490
Operating results (1) Earnings per common share 4.77 3.73
Diluted earnings per common share 4.68 3.64
Dividends paid per common share 1.85 1.59
Return on average assets 1.34%1.11%
Return on average common
shareholders’ equity 17.70 14.54
Efficiency ratio 55.30 61.15
Average common shares issued
and outstanding (in millions) 1,726 1,732
For the year Earnings per common share $$5.28 $4.25
Cash basis Diluted earnings per common share 5.19 4.15
Financial data (1)(2) Return on average tangible assets 1.52% 1.30%
Return on average tangible common
shareholders’ equity 28.46 25.24
Efficiency ratio 52.57 58.20
At year end Total assets $$632,574 $617,679
Total loans and leases 370,662 357,328
Total deposits 347,273 357,260
Total shareholders’ equity 44,432 45,938
Common shareholders’ equity 44,355 45,866
Book value per common share 26.44 26.60
Market price per share of
common stock 50.19 60.13
Common shares issued and
outstanding (in millions) 1,677 1,724
(1) Excludes merger-related charges.
(2) Cash basis calculations exclude goodwill and other intangible assets and the related amortization expense.