Electronic Arts 1999 Annual Report Download - page 13
Download and view the complete annual report
Please find page 13 of the 1999 Electronic Arts annual report below. You can navigate through the pages in the report by either clicking on the pages listed below, or by using the keyword search tool below to find specific information within the annual report.-
 1
1 -
2
-
 3
3 -
 4
4 -
 5
5 -
 6
6 -
 7
7 -
 8
8 -
 9
9 -
 10
10 -
 11
11 -
 12
12 -
 13
13 -
 14
14 -
 15
15 -
 16
16 -
 17
17 -
 18
18 -
 19
19 -
 20
20 -
 21
21 -
 22
22 -
 23
23 -
24
-
25
-
26
-
27
-
28
-
29
-
30
-
31
-
32
-
33
-
34
-
35
-
36
-
37
-
38
-
39
-
40
-
41
-
42
-
43
-
44
-
45
-
46
-
47
-
48
-
49
 |
 |

Though we currently expect that the acquired in-process technology will be successfully developed, there can be no
assurance that commercial or technical viability of these products will be achieved. Furthermore, future developments in
the entertainment software industry, changes in computer or video game console technology, changes in other product
offerings or other developments may cause us to alter or abandon these plans.
The value assigned to purchased in-process technology was determined by estimating the completion percentage of
research and development efforts at the acquisition date, forecasting risk adjusted revenues considering the completion
percentage, estimating the resulting net cash flows from the projects and discounting the net cash flows to their present
values. The completion percentages were estimated based on cost incurred to date, importance of the completed develop-
ment tasks and the elapsed portion of the total project time. The revenue projection used to value the in-process research
and development is based on unit sales forecasts for worldwide sales territories and adjusted to consider only the revenue
related to development achievements completed at the acquisition date. Net cash flow estimates include cost of goods
sold and sales, marketing and general and administrative expenses and taxes forecasted based on historical operating
characteristics. In addition, net cash flow estimates were adjusted to allow for fair return on working capital and fixed
assets, charges for franchise and technology leverage and return on other intangibles. Appropriate risk adjusted discount
rates ranging from 20% to 22.5% were used to discount the net cash flows back to their present value. The remaining
identified intangibles will be amortized on a straight-line basis over two to twelve years based on expected useful lives
of franchise tradenames, existing products and technologies, retention of workforce, and other intangible assets. If these
projects are not successfully developed, we may not realize the value assigned to the in-process research and develop-
ment projects. In addition, the value of other acquired intangible assets may also become impaired.
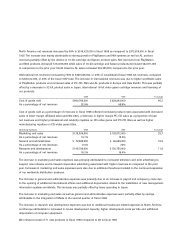
In conjunction with the merger of Westwood, we accrued approximately $1,500,000 related to direct transaction costs and
other related accruals. At March 31, 1999, there were $725,000 in accruals remaining related to these items.
Additionally, for fiscal 1999, the charge for in-process research and development also included write-offs of $2,279,000
associated with the acquisition of two software development companies in the first quarter.
For fiscal 1998, we incurred a charge of $1,500,000 for acquired in-process technology in connection with the acquisition
of the remaining 35% minority ownership interest in Electronic Arts Victor, Inc. in December 1997. This charge was made
after we concluded that the in-process technology had no alternative future use after taking into consideration the poten-
tial for usage of the software in different products and resale of the software.
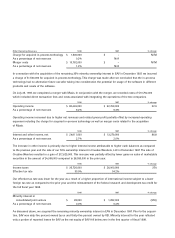
On July 25, 1997, we completed a merger with Maxis Inc. (“Maxis”). In conjunction with the merger, we recorded costs
of $10,792,000 which included direct transaction fees and costs associated with integrating the operations of the two
companies. At March 31, 1999, there were no accruals remaining related to these merger costs.
1999 1998 % change
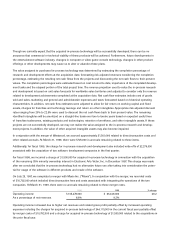
Operating income $ 105,278,000 $ 83,449,000 26.2
As a percentage of net revenues 8.6% 9.2%
Operating income increased due to higher net revenues and related gross profit partially offset by increased operating
expenses including the charges for acquired in-process technology of $44,115,000 in the current fiscal year partially offset
by merger costs of $10,792,000 and a charge for acquired in-process technology of $1,500,000 related to the acquisitions in
the prior fiscal year.