Electronic Arts 1999 Annual Report Download - page 9
Download and view the complete annual report
Please find page 9 of the 1999 Electronic Arts annual report below. You can navigate through the pages in the report by either clicking on the pages listed below, or by using the keyword search tool below to find specific information within the annual report.-
 1
1 -
 2
2 -
 3
3 -
 4
4 -
 5
5 -
 6
6 -
 7
7 -
 8
8 -
 9
9 -
 10
10 -
 11
11 -
 12
12 -
 13
13 -
 14
14 -
 15
15 -
 16
16 -
 17
17 -
 18
18 -
 19
19 -
 20
20 -
21
-
22
-
23
-
24
-
25
-
26
-
27
-
28
-
29
-
30
-
31
-
32
-
33
-
34
-
35
-
36
-
37
-
38
-
39
-
40
-
41
-
42
-
43
-
44
-
45
-
46
-
47
-
48
-
49
 |
 |

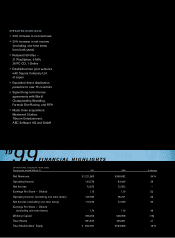
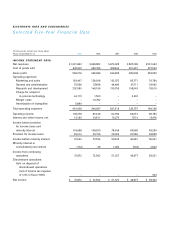
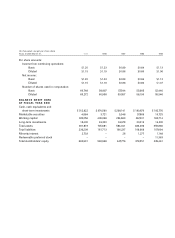
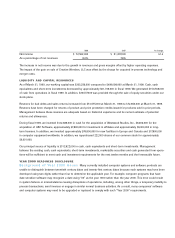
(In thousands, except per share data)
Years ended March 31, 1999 1998 1997 1996 1995
Per share amounts:
Income from continuing operations:
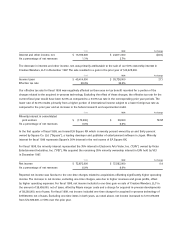
Basic $1.20 $1.23 $0.89 $0.84 $1.13
Diluted $1.15 $1.19 $0.86 $0.80 $1.06
Net income:
Basic $1.20 $1.23 $0.89 $0.84 $1.13
Diluted $1.15 $1.19 $0.86 $0.80 $1.07
Number of shares used in computation:
Basic 60,748 58,867 57,544 55,685 52,446
Diluted 63,272 60,958 59,557 58,190 55,546
BALANCE SHEET DATA
AT FISCAL YEAR END
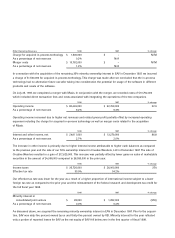
Cash, cash equivalents and
short-term investments $ 312,822 $ 374,560 $ 268,141 $ 190,873 $ 182,776
Marketable securities 4,884 3,721 5,548 37,869 10,725
Working capital 333,256 408,098 284,863 247,001 180,714
Long-term investments 18,400 24,200 34,478 30,319 14,200
Total assets 901,873 745,681 584,041 489,496 359,866
Total liabilities 236,209 181,713 136,237 108,668 107,894
Minority interest 2,733 – 28 1,277 1,148
Redeemable preferred stock ––––11,363
Total stockholders’ equity 662,931 563,968 447,776 379,551 239,461