Electronic Arts 1999 Annual Report Download - page 26
Download and view the complete annual report
Please find page 26 of the 1999 Electronic Arts annual report below. You can navigate through the pages in the report by either clicking on the pages listed below, or by using the keyword search tool below to find specific information within the annual report.-
 1
1 -
2
-
3
-
4
-
5
-
6
-
7
-
8
-
9
-
10
-
11
-
12
-
13
-
14
-
15
-
 16
16 -
 17
17 -
 18
18 -
 19
19 -
 20
20 -
 21
21 -
 22
22 -
 23
23 -
 24
24 -
 25
25 -
 26
26 -
 27
27 -
 28
28 -
 29
29 -
 30
30 -
 31
31 -
 32
32 -
 33
33 -
 34
34 -
 35
35 -
 36
36 -
37
-
38
-
39
-
40
-
41
-
42
-
43
-
44
-
45
-
46
-
47
-
48
-
49
 |
 |

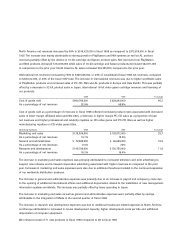
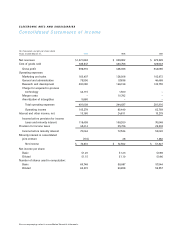
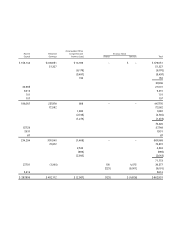
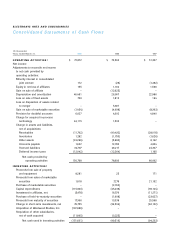
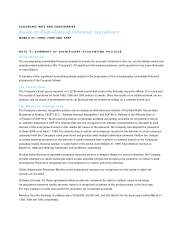
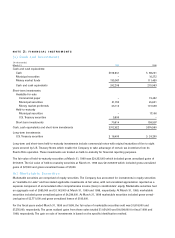
ELECTRONIC ARTS AND SUBSIDIARIES
Consolidated Statements of Cash Flows
(In thousands)
Years ended March 31, 1999 1998 1997
OPERATING ACTIVITIES:$ 72,872 $ 72,562 $ 51,327
Net income
Adjustments to reconcile net income
to net cash provided by
operating activities:
Minority interest in consolidated
joint venture 172 (28) (1,282)
Equity in net loss of affiliates 155 1,162 1,566
Gain on sale of affiliate – (12,625) –
Depreciation and amortization 40,461 26,907 22,986
Loss on sale of fixed assets 729 1,813 164
Loss on disposition of assets related
to merger – 5,607 –
Gain on sale of marketable securities (1,454) (4,098) (8,393)
Provision for doubtful accounts 6,027 4,302 4,840
Charge for acquired in-process
technology 44,115 1,500 –
Change in assets and liabilities,
net of acquisitions:
Receivables (11,702) (40,432) (28,018)
Inventories 1,282 (1,753) (1,626)
Other assets (24,266) (5,660) 8,142
Accounts payable 1,622 12,783 4,824
Accrued liabilities 32,797 29,217 24,307
Deferred income taxes (12,042) (12,264) 1,165
Net cash provided by
operating activities 150,768 78,993 80,002
INVESTING ACTIVITIES:
Proceeds from sale of property
and equipment 8,281 25 171
Proceeds from sales of marketable
securities 1,818 7,276 21,152
Purchase of marketable securities – (2,762) –
Capital expenditures (115,820) (45,238) (39,124)
Investment in affiliates, net (5,478) 16,579 (11,271)
Purchase of held-to-maturity securities – (1,008) (23,627)
Proceeds from maturity of securities 17,306 13,338 20,598
Change in short-term investments, net 76,755 (34,504) (62,132)
Acquisition of Westwood Studios, Inc. (122,688) – –
Acquisition of other subsidiaries,
net of cash acquired (11,805) (3,225) –
Net cash used in investing activities (151,631) (49,519) (94,233)