Electronic Arts 1999 Annual Report Download - page 44
Download and view the complete annual report
Please find page 44 of the 1999 Electronic Arts annual report below. You can navigate through the pages in the report by either clicking on the pages listed below, or by using the keyword search tool below to find specific information within the annual report.-
 1
1 -
2
-
3
-
4
-
5
-
6
-
7
-
8
-
9
-
10
-
11
-
12
-
13
-
14
-
15
-
16
-
17
-
18
-
19
-
20
-
21
-
22
-
23
-
24
-
25
-
26
-
27
-
28
-
29
-
30
-
31
-
32
-
33
-
 34
34 -
 35
35 -
 36
36 -
 37
37 -
 38
38 -
 39
39 -
 40
40 -
 41
41 -
 42
42 -
 43
43 -
 44
44 -
 45
45 -
 46
46 -
 47
47 -
 48
48 -
 49
49
 |
 |

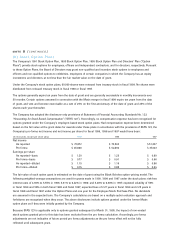
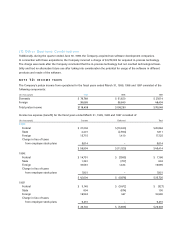
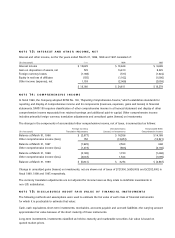
NOTE 13: INTEREST AND OTHER INCOME, NET
Interest and other income, net for the years ended March 31, 1999, 1998 and 1997 consisted of:
(In thousands) 1999 1998 1997
Interest income $ 12,625 $ 13,649 $ 9,699
Gain on disposition of assets, net 725 14,910 8,229
Foreign currency losses (1,168) (517) (1,024)
Equity in net loss of affiliates (155) (1,162) (1,566)
Other income (expense), net 1,153 (2,069) (2,059)
$ 13,180 $ 24,811 $ 13,279
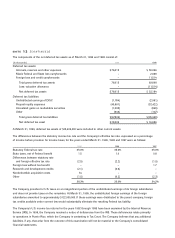
NOTE 14: COMPREHENSIVE INCOME
In fiscal 1999, the Company adopted SFAS No. 130, “Reporting Comprehensive Income,” which establishes standards for
reporting and display of comprehensive income and its components (revenues, expenses, gains and losses) in financial
statements. SFAS 130 requires classification of other comprehensive income in a financial statement and display of other
comprehensive income separately from retained earnings and additional paid-in capital. Other comprehensive income
includes primarily foreign currency translation adjustments and unrealized gains (losses) on investments.
The change in the components of accumulated other comprehensive income, net of taxes, is summarized as follows:
Foreign Currency Unrealized Gains Accumulated Other
(In thousands) Translation Adjustments (Losses) on Investments Comprehensive Income
Balance at March 31, 1996 $ (2,077) $ 16,266 $ 14,189
Other comprehensive income (loss) 152 (13,673) (13,521)
Balance at March 31, 1997 (1,925) 2,593 668
Other comprehensive income (loss) (1,273) (863) (2,136)
Balance at March 31, 1998 (3,198) 1,730 (1,468)
Other comprehensive income (loss) (2,643) 1,544 (1,099)
Balance at March 31, 1999 $ (5,841) $ 3,274 $ (2,567)
Change in unrealized gains (losses) on investments, net are shown net of taxes of $727,000, $(426,000) and $(7,202,000) in
fiscal 1999, 1998 and 1997, respectively.
The currency translation adjustments are not adjusted for income taxes as they relate to indefinite investments in
non-U.S. subsidiaries.
NOTE 15: DISCLOSURES ABOUT FAIR VALUE OF FINANCIAL INSTRUMENTS
The following methods and assumptions were used to estimate the fair value of each class of financial instruments
for which it is practicable to estimate that value:
Cash, cash equivalents, short-term investments, receivables, accounts payable and accrued liabilities—the carrying amount
approximates fair value because of the short maturity of these instruments.
Long-term investments, investments classified as held-to-maturity and marketable securities—fair value is based on
quoted market prices.