Electronic Arts 1999 Annual Report Download - page 33
Download and view the complete annual report
Please find page 33 of the 1999 Electronic Arts annual report below. You can navigate through the pages in the report by either clicking on the pages listed below, or by using the keyword search tool below to find specific information within the annual report.-
 1
1 -
2
-
3
-
4
-
5
-
6
-
7
-
8
-
9
-
10
-
11
-
12
-
13
-
14
-
15
-
16
-
17
-
18
-
19
-
20
-
21
-
22
-
 23
23 -
 24
24 -
 25
25 -
 26
26 -
 27
27 -
 28
28 -
 29
29 -
 30
30 -
 31
31 -
 32
32 -
 33
33 -
 34
34 -
 35
35 -
 36
36 -
 37
37 -
 38
38 -
 39
39 -
 40
40 -
 41
41 -
 42
42 -
 43
43 -
44
-
45
-
46
-
47
-
48
-
49
 |
 |

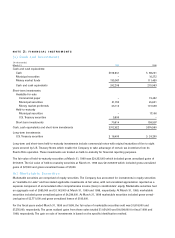
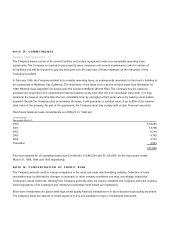
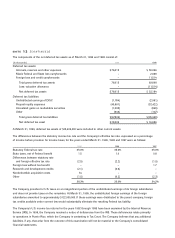
NOTE 2: FINANCIAL INSTRUMENTS
(a) Cash and Investments
(In thousands)
March 31, 1999 1998
Cash and cash equivalents:
Cash $106,641 $ 88,241
Municipal securities – 16,272
Money market funds 135,567 111,450
Cash and cash equivalents 242,208 215,963
Short-term investments:
Available-for-sale
Commercial paper – 15,452
Municipal securities 21,700 24,601
Money market preferreds 43,114 101,438
Held-to-maturity
Municipal securities – 17,106
U.S. Treasury securities 5,800 –
Short-term investments 70,614 158,597
Cash, cash equivalents and short-term investments $312,822 $374,560
Long-term investments:
U.S. Treasury securities $ 18,400 $ 24,200
Long-term and short-term held-to-maturity investments include commercial notes with original maturities of five to eight
years secured by U.S. Treasury Notes which enable the Company to take advantage of certain tax incentives from its
Puerto Rico operation. These investments are treated as held-to-maturity for financial reporting purposes.
The fair value of held-to-maturity securities at March 31, 1999 was $24,353,000 which included gross unrealized gains of
$153,000. The fair value of held-to-maturity securities at March 31, 1998 was $41,326,000 which included gross unrealized
gains of $27,000 and gross unrealized losses of $7,000.
(b) Marketable Securities
Marketable securities are comprised of equity securities. The Company has accounted for investments in equity securities
as “available-for-sale” and has stated applicable investments at fair value, with net unrealized appreciation reported as a
separate component of accumulated other comprehensive income (loss) in stockholders’ equity. Marketable securities had
an aggregate cost of $585,000 and $1,143,000 at March 31, 1999 and 1998, respectively. At March 31, 1999, marketable
securities included gross unrealized gains of $4,299,000. At March 31, 1998 marketable securities included gross unreal-
ized gains of $2,771,000 and gross unrealized losses of $193,000.
For the fiscal years ended March 31, 1999 and 1998, the fair value of marketable securities sold was $1,818,000 and
$7,276,000, respectively. The gross realized gains from these sales totaled $1,454,000 and $4,098,000 for fiscal 1999 and
1998, respectively. The gain on sale of investments is based on the specific identification method.