GE 2005 Annual Report Download - page 103
Download and view the complete annual report
Please find page 103 of the 2005 GE annual report below. You can navigate through the pages in the report by either clicking on the pages listed below, or by using the keyword search tool below to find specific information within the annual report.-
 1
1 -
2
-
3
-
4
-
5
-
6
-
7
-
8
-
9
-
10
-
11
-
12
-
13
-
14
-
15
-
16
-
17
-
18
-
19
-
20
-
21
-
22
-
23
-
24
-
25
-
26
-
27
-
28
-
29
-
30
-
31
-
32
-
33
-
34
-
35
-
36
-
37
-
38
-
39
-
40
-
41
-
42
-
43
-
44
-
45
-
46
-
47
-
48
-
49
-
50
-
51
-
52
-
53
-
54
-
55
-
56
-
57
-
58
-
59
-
60
-
61
-
62
-
63
-
64
-
65
-
66
-
67
-
68
-
69
-
70
-
71
-
72
-
73
-
74
-
75
-
76
-
77
-
78
-
79
-
80
-
81
-
82
-
83
-
84
-
85
-
86
-
87
-
88
-
89
-
90
-
91
-
92
-
 93
93 -
 94
94 -
 95
95 -
 96
96 -
 97
97 -
 98
98 -
 99
99 -
 100
100 -
 101
101 -
 102
102 -
 103
103 -
 104
104 -
 105
105 -
 106
106 -
 107
107 -
 108
108 -
 109
109 -
 110
110 -
 111
111 -
 112
112 -
 113
113 -
114
-
115
-
116
-
117
-
118
-
119
-
120
-
121
-
122
-
123
-
124
-
125
-
126
-
127
-
128
-
129
-
130
-
131
-
132
-
133
-
134
-
135
-
136
-
137
-
138
-
139
-
140
-
141
-
142
-
143
-
144
-
145
-
146
-
147
-
148
-
149
-
150
-
151
-
152
-
153
-
154
-
155
-
156
-
157
-
158
-
159
-
160
-
161
-
162
-
163
-
164
 |
 |

(103)
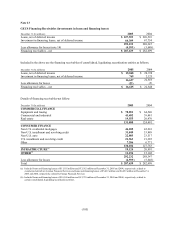
CONTRACTUAL MATURITIES OF GECS INVESTMENT IN AVAILABLE-FOR-SALE DEBT
SECURITIES (EXCLUDING MORTGAGE-BACKED AND ASSET-BACKED SECURITIES)
(In millions)
Amortized
cost
Estimated
fair value
Due in
2006 $ 2,447 $ 2,444
2007-2010 4,603 4,601
2011-2015 4,786 4,874
2016 and later 15,845 17,326
We expect actual maturities to differ from contractual maturities because borrowers have the right to call or prepay
certain obligations.
Supplemental information about gross realized gains and losses on available-for-sale investment securities
follows.
(In millions) 2005 2004 2003
GE
Gains $ 6 $ 15 $ 3
Losses, including impairments (5)
–
(38 )
Net 1 15 (35)
GECS
Gains
514 413 522
Losses, including impairments (133) (209 ) (317)
Net 381 204 205
Total $382 $219 $170
Proceeds from available-for-sale investment securities sales amounted to $14,100 million, $12,000 million and
$12,400 million in 2005, 2004 and 2003, respectively.
GECS TRADING SECURITIES
Gains and losses on trading securities are for the benefit of certain non-U.S. insurance contractholders. In 2005 and
2004, we recognized net pre-tax gains on such securities of $862 million and $284 million, respectively, and
recognized corresponding insurance losses of $860 million and $280 million, respectively, reflecting the
contractholders participation in the actual returns generated by these investments.