GE 2005 Annual Report Download - page 115
Download and view the complete annual report
Please find page 115 of the 2005 GE annual report below. You can navigate through the pages in the report by either clicking on the pages listed below, or by using the keyword search tool below to find specific information within the annual report.-
 1
1 -
2
-
3
-
4
-
5
-
6
-
7
-
8
-
9
-
10
-
11
-
12
-
13
-
14
-
15
-
16
-
17
-
18
-
19
-
20
-
21
-
22
-
23
-
24
-
25
-
26
-
27
-
28
-
29
-
30
-
31
-
32
-
33
-
34
-
35
-
36
-
37
-
38
-
39
-
40
-
41
-
42
-
43
-
44
-
45
-
46
-
47
-
48
-
49
-
50
-
51
-
52
-
53
-
54
-
55
-
56
-
57
-
58
-
59
-
60
-
61
-
62
-
63
-
64
-
65
-
66
-
67
-
68
-
69
-
70
-
71
-
72
-
73
-
74
-
75
-
76
-
77
-
78
-
79
-
80
-
81
-
82
-
83
-
84
-
85
-
86
-
87
-
88
-
89
-
90
-
91
-
92
-
93
-
94
-
95
-
96
-
97
-
98
-
99
-
100
-
101
-
102
-
103
-
104
-
 105
105 -
 106
106 -
 107
107 -
 108
108 -
 109
109 -
 110
110 -
 111
111 -
 112
112 -
 113
113 -
 114
114 -
 115
115 -
 116
116 -
 117
117 -
 118
118 -
 119
119 -
 120
120 -
 121
121 -
 122
122 -
 123
123 -
 124
124 -
 125
125 -
126
-
127
-
128
-
129
-
130
-
131
-
132
-
133
-
134
-
135
-
136
-
137
-
138
-
139
-
140
-
141
-
142
-
143
-
144
-
145
-
146
-
147
-
148
-
149
-
150
-
151
-
152
-
153
-
154
-
155
-
156
-
157
-
158
-
159
-
160
-
161
-
162
-
163
-
164
 |
 |

(115)
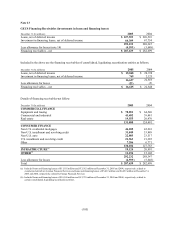
Note 17
All Other Assets (Restated)
December 31 (In millions)
2005
(Restated)
2004
(Restated)
GE
Investments
Associated companies $1,824
$1,830
Other(a)(b) 1,089 3,974
2,913 5,804
Prepaid pension asset – principal plans 17,853 17,629
Contract costs and estimated earnings 4,664 4,089
Film and television costs 3,828 3,441
Long-term receivables, including notes 2,790 2,821
Derivative instruments 247 628
Other 4,457 3,711
36,752 38,123
GECS
Investments
Associated companies 13,481 10,644
Real estate(c) 16,467 19,163
Assets held for sale(d) 8,574 6,501
Cost method(e) 2,280 2,392
Other 3,072 3,876
43,874 42,576
Deferred acquisition costs 1,541 1,619
Derivative instruments 1,601 3,162
Advances to suppliers 1,762 1,754
Other 3,259 3,571
52,037 52,682
ELIMINATIONS (1,364) (1,138)
Total(f) $ 87,425 $ 89,667
(a) The fair value of and unrealized loss on cost method investments in a continuous loss position in 2005 were insignificant. The fair value of
and unrealized loss on cost method investments in a continuous loss position for less than 12 months in 2004 were $373 million and $34
million, respectively. Also included available-for-sale securities of $1,200 million in 2004, of which the unrealized loss on those in a
continuous loss position for less than 12 months in 2004 was $111 million.
(b) 2004 amounts included investments associated with the VUE settlement in 2005. See note 16 for further information.
(c) GECS investment in real estate consisted principally of two categories: real estate held for investment and equity method investments.
Both categories contained a wide range of properties including the following at December 31, 2005: office buildings (52%), apartment
buildings (20%), retail facilities (7%), industrial properties (6%), parking facilities (5%), franchise properties (3%) and other (7%). At
December 31, 2005, investments were located in Europe (46%), North America (35%) and Asia (19%).
(d) Assets were classified as held for sale on the date a decision was made to dispose of them through sale, securitization or other means. Such
assets consisted primarily of real estate properties and mortgage and credit card receivables, and were accounted for at the lower of
carrying amount or estimated fair value less costs to sell.
(e) The fair value of and unrealized loss on those investments in a continuous loss position for less than 12 months in 2005 were $100 million
and $31 million, respectively. The fair value of and unrealized loss on those investments in a continuous loss position for 12 months or
more in 2005 were $22 million and $9 million, respectively. The fair value of and unrealized loss on those investments in a continuous
loss position for less than 12 months in 2004 were $56 million and $25 million, respectively. The fair value of and unrealized loss on those
investments in a continuous loss position for 12 months or more in 2004 were $55 million and $42 million, respectively.
(f) Included $1,235 million in 2005 and $2,384 million in 2004 related to consolidated, liquidating securitization entities. See note 28.