GE 2005 Annual Report Download - page 64
Download and view the complete annual report
Please find page 64 of the 2005 GE annual report below. You can navigate through the pages in the report by either clicking on the pages listed below, or by using the keyword search tool below to find specific information within the annual report.-
 1
1 -
2
-
3
-
4
-
5
-
6
-
7
-
8
-
9
-
10
-
11
-
12
-
13
-
14
-
15
-
16
-
17
-
18
-
19
-
20
-
21
-
22
-
23
-
24
-
25
-
26
-
27
-
28
-
29
-
30
-
31
-
32
-
33
-
34
-
35
-
36
-
37
-
38
-
39
-
40
-
41
-
42
-
43
-
44
-
45
-
46
-
47
-
48
-
49
-
50
-
51
-
52
-
53
-
 54
54 -
 55
55 -
 56
56 -
 57
57 -
 58
58 -
 59
59 -
 60
60 -
 61
61 -
 62
62 -
 63
63 -
 64
64 -
 65
65 -
 66
66 -
 67
67 -
 68
68 -
 69
69 -
 70
70 -
 71
71 -
 72
72 -
 73
73 -
 74
74 -
75
-
76
-
77
-
78
-
79
-
80
-
81
-
82
-
83
-
84
-
85
-
86
-
87
-
88
-
89
-
90
-
91
-
92
-
93
-
94
-
95
-
96
-
97
-
98
-
99
-
100
-
101
-
102
-
103
-
104
-
105
-
106
-
107
-
108
-
109
-
110
-
111
-
112
-
113
-
114
-
115
-
116
-
117
-
118
-
119
-
120
-
121
-
122
-
123
-
124
-
125
-
126
-
127
-
128
-
129
-
130
-
131
-
132
-
133
-
134
-
135
-
136
-
137
-
138
-
139
-
140
-
141
-
142
-
143
-
144
-
145
-
146
-
147
-
148
-
149
-
150
-
151
-
152
-
153
-
154
-
155
-
156
-
157
-
158
-
159
-
160
-
161
-
162
-
163
-
164
 |
 |

(64)
We believe that meaningful analysis of our financial performance requires an understanding of the factors
underlying that performance and our judgments about the likelihood that particular factors will repeat. In some
cases, short-term patterns and long-term trends may be obscured by large factors or events. For example, events or
trends in a particular segment may be so significant as to obscure patterns and trends of our industrial or financial
services businesses in total. For this reason, we believe that investors may find it useful to see our 2005 revenue
growth without the effect of acquisitions, dispositions, currency exchange rates, and the effects of the GECS
commercial paper interest rate swap adjustment, and without the effects of the 2004 Olympics broadcasts and the
May 2005 SFAS 133 correction which effects have no counterpart in 2005 and if included would overshadow trends
in ongoing revenues. Similarly, we believe that investors would find it useful to compare our 2005 operating cash
flow against our 2004 operating cash flow without the impact of GECS dividends.
Delinquency Rates on Certain Financing Receivables
Delinquency rates on managed Commercial Finance equipment loans and leases and managed Consumer Finance
financing receivables follow.
COMMERCIAL FINANCE
December 31 2005 2004 2003
Managed
1.31% 1.40% 1.38%
Off-book
0.76 0.90 1.27
On-book
1.53 1.58 1.41
CONSUMER FINANCE
December 31 2005 2004 2003
Managed
5.08% 4.85% 5.62%
Off-book
5.28 5.09 5.04
On-book
5.07 4.84 5.67
We believe that delinquency rates on managed financing receivables provide a useful perspective on our on and off-
book portfolio quality and are key indicators of financial performance.
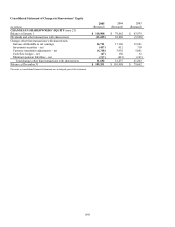
Average Total Shareowners’ Equity, Excluding Effects of Discontinued Operations(a)
December 31 (In millions) 2005 2004 2003 2002 2001
Average total shareowners’ equity(b) – as reported $111,683 $ 95,656 $ 71,336 $ 59,174 $ 52,674
Less:
Cumulative effect of losses from
discontinued operations(c)
3,094 2,980 925 1,007 226
Average net investment in discontinued
operations(d)
4,620
–
–
–
–
Average total shareowners’ equity,
excluding effects of discontinued
operations(a) – as reported $103,969 $ 92,676 $ 70,411 $ 58,167 $ 52,448