GE 2005 Annual Report Download - page 105
Download and view the complete annual report
Please find page 105 of the 2005 GE annual report below. You can navigate through the pages in the report by either clicking on the pages listed below, or by using the keyword search tool below to find specific information within the annual report.-
 1
1 -
2
-
3
-
4
-
5
-
6
-
7
-
8
-
9
-
10
-
11
-
12
-
13
-
14
-
15
-
16
-
17
-
18
-
19
-
20
-
21
-
22
-
23
-
24
-
25
-
26
-
27
-
28
-
29
-
30
-
31
-
32
-
33
-
34
-
35
-
36
-
37
-
38
-
39
-
40
-
41
-
42
-
43
-
44
-
45
-
46
-
47
-
48
-
49
-
50
-
51
-
52
-
53
-
54
-
55
-
56
-
57
-
58
-
59
-
60
-
61
-
62
-
63
-
64
-
65
-
66
-
67
-
68
-
69
-
70
-
71
-
72
-
73
-
74
-
75
-
76
-
77
-
78
-
79
-
80
-
81
-
82
-
83
-
84
-
85
-
86
-
87
-
88
-
89
-
90
-
91
-
92
-
93
-
94
-
 95
95 -
 96
96 -
 97
97 -
 98
98 -
 99
99 -
 100
100 -
 101
101 -
 102
102 -
 103
103 -
 104
104 -
 105
105 -
 106
106 -
 107
107 -
 108
108 -
 109
109 -
 110
110 -
 111
111 -
 112
112 -
 113
113 -
 114
114 -
 115
115 -
116
-
117
-
118
-
119
-
120
-
121
-
122
-
123
-
124
-
125
-
126
-
127
-
128
-
129
-
130
-
131
-
132
-
133
-
134
-
135
-
136
-
137
-
138
-
139
-
140
-
141
-
142
-
143
-
144
-
145
-
146
-
147
-
148
-
149
-
150
-
151
-
152
-
153
-
154
-
155
-
156
-
157
-
158
-
159
-
160
-
161
-
162
-
163
-
164
 |
 |

(105)
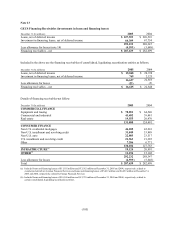
Note 13
GECS Financing Receivables (investments in loans and financing leases)
December 31 (In millions) 2005
2004
Loans, net of deferred income $227,923
$220,593
Investment in financing leases, net of deferred income 64,309
67,754
292,232
288,347
Less allowance for losses (note 14) (4,593 ) (5,648)
Financing receivables – net $287,639
$282,699
Included in the above are the financing receivables of consolidated, liquidating securitization entities as follows:
December 31 (In millions) 2005 2004
Loans, net of deferred income $ 15,868 $ 20,728
Investment in financing leases, net of deferred income 769 2,125
16,637 22,853
Less allowance for losses (22) (5)
Financing receivables – net $ 16,615 $ 22,848
Details of financing receivables-net follow.
December 31 (In millions) 2005 2004
COMMERCIAL FINANCE
Equipment and leasing $70,851
$ 64,540
Commercial and industrial 41,402
39,481
Real estate 19,555
20,470
131,808
124,491
CONSUMER FINANCE
Non-U.S. residential mortgages 46,205
42,201
Non-U.S. installment and revolving credit 31,849
33,889
Non-U.S. auto 22,803
23,517
U.S. installment and revolving credit 21,963
21,385
Other 7,286
6,771
130,106
127,763
INFRASTRUCTURE(a)
19,124
20,991
OTHER(b)
11,194
15,102
292,232
288,347
Less allowance for losses (4,593 ) (5,648)
Total $287,639
$282,699
(a) Included loans and financing leases of $11,192 million and $13,562 million at December 31, 2005 and 2004, respectively, related to
commercial aircraft at Aviation Financial Services and loans and financing leases of $5,419 million and $4,659 million at December 31,
2005 and 2004, respectively, related to Energy Financial Services.
(b) Included loans and financing leases of $10,160 million and $13,759 million at December 31, 2005 and 2004, respectively, related to
certain consolidated, liquidating securitization entities.