HP 2006 Annual Report Download - page 145
Download and view the complete annual report
Please find page 145 of the 2006 HP annual report below. You can navigate through the pages in the report by either clicking on the pages listed below, or by using the keyword search tool below to find specific information within the annual report.-
 1
1 -
2
-
3
-
4
-
5
-
6
-
7
-
8
-
9
-
10
-
11
-
12
-
13
-
14
-
15
-
16
-
17
-
18
-
19
-
20
-
21
-
22
-
23
-
24
-
25
-
26
-
27
-
28
-
29
-
30
-
31
-
32
-
33
-
34
-
35
-
36
-
37
-
38
-
39
-
40
-
41
-
42
-
43
-
44
-
45
-
46
-
47
-
48
-
49
-
50
-
51
-
52
-
53
-
54
-
55
-
56
-
57
-
58
-
59
-
60
-
61
-
62
-
63
-
64
-
65
-
66
-
67
-
68
-
69
-
70
-
71
-
72
-
73
-
74
-
75
-
76
-
77
-
78
-
79
-
80
-
81
-
82
-
83
-
84
-
85
-
86
-
87
-
88
-
89
-
90
-
91
-
92
-
93
-
94
-
95
-
96
-
97
-
98
-
99
-
100
-
101
-
102
-
103
-
104
-
105
-
106
-
107
-
108
-
109
-
110
-
111
-
112
-
113
-
114
-
115
-
116
-
117
-
118
-
119
-
120
-
121
-
122
-
123
-
124
-
125
-
126
-
127
-
128
-
129
-
130
-
131
-
132
-
133
-
134
-
 135
135 -
 136
136 -
 137
137 -
 138
138 -
 139
139 -
 140
140 -
 141
141 -
 142
142 -
 143
143 -
 144
144 -
 145
145 -
 146
146 -
 147
147 -
 148
148 -
 149
149 -
 150
150 -
 151
151 -
 152
152 -
 153
153 -
 154
154 -
 155
155 -
156
-
157
-
158
-
159
-
160
-
161
-
162
-
163
-
164
-
165
-
166
-
167
-
168
 |
 |

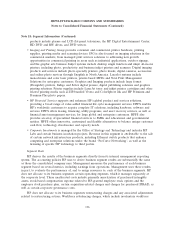
HEWLETT-PACKARD COMPANY AND SUBSIDIARIES
Quarterly Summary
(Unaudited)
Three-month periods ended
January 31 April 30 July 31 October 31
In millions, except per share amounts
2006
Net revenue .......................................... $22,659 $22,554 $21,890 $24,555
Cost of sales(1) ......................................... 17,392 16,970 16,472 18,593
Research and development ................................. 871 930 920 870
Selling, general and administrative ............................ 2,692 2,858 2,830 2,886
Amortization of purchased intangible assets ...................... 147 151 153 153
Restructuring ......................................... 15 (14) 5 152
In-process research and development charges ..................... 50 2 — —
Total costs and expenses ................................... 21,167 20,897 20,380 22,654
Earnings from operations .................................. 1,492 1,657 1,510 1,901
Interest and other, net .................................... 38 157 221 190
(Losses) gains on investments ............................... (2) 6 7 14
Earnings before taxes .................................... 1,528 1,820 1,738 2,105
Provision for (benefit from) taxes ............................. 301 (79) 363 408
Net earnings .......................................... $1,227 $ 1,899 $ 1,375 $ 1,697
Net earnings per share:(2)
Basic ............................................... $ 0.43 $ 0.68 $ 0.50 $ 0.62
Diluted ............................................. $ 0.42 $ 0.66 $ 0.48 $ 0.60
Cash dividends paid per share ............................... $ 0.08 $ 0.08 $ 0.08 $ 0.08
Range of per share closing stock prices on the New York Stock Exchange and
Nasdaq Stock Market:
Low.............................................. $28.12 $ 30.27 $ 29.79 $ 31.67
High ............................................. $32.24 $ 34.36 $ 33.87 $ 39.87
2005
Net revenue .......................................... $21,454 $21,570 $20,759 $22,913
Cost of sales(1) ......................................... 16,537 16,429 15,942 17,532
Research and development ................................. 878 890 863 859
Selling, general and administrative ............................ 2,704 2,933 2,761 2,786
Amortization of purchased intangible assets ...................... 167 151 168 136
Pension curtailment gains .................................. — — — (199)
Restructuring charges .................................... 3 4 112 1,565
In-process research and development charges ..................... — — — 2
Total costs and expenses ................................... 20,289 20,407 19,846 22,681
Earnings from operations .................................. 1,165 1,163 913 232
Interest and other, net .................................... 25 (87) 119 132
(Losses) gains on investments ............................... (24) 3 (6) 14
Dispute settlement ...................................... (116) — 7 3
Earnings before taxes .................................... 1,050 1,079 1,033 381
Provision for (benefit from) taxes ............................. 107 113 960 (35)
Net earnings .......................................... $ 943 $ 966 $ 73 $ 416
Net earnings per share:(2)
Basic ............................................. $ 0.32 $ 0.33 $ 0.03 $ 0.15
Diluted ............................................ $ 0.32 $ 0.33 $ 0.03 $ 0.14
Cash dividends paid per share ............................... $ 0.08 $ 0.08 $ 0.08 $ 0.08
Range of per share closing stock prices on the New York Stock Exchange and
Nasdaq Stock Market:
Low.............................................. $18.76 $ 19.57 $ 20.15 $ 23.70
High ............................................. $21.33 $ 22.00 $ 24.94 $ 29.20
(1) Cost of products, cost of services and financing interest.
(2) EPS for each quarter is computed using the weighted-average number of shares outstanding during that quarter, while EPS
for the fiscal year is computed using the weighted-average number of shares outstanding during the year. Thus, the sum of
the EPS for each of the four quarters may not equal the EPS for the fiscal year.
141