HP 2006 Annual Report Download - page 56
Download and view the complete annual report
Please find page 56 of the 2006 HP annual report below. You can navigate through the pages in the report by either clicking on the pages listed below, or by using the keyword search tool below to find specific information within the annual report.-
 1
1 -
2
-
3
-
4
-
5
-
6
-
7
-
8
-
9
-
10
-
11
-
12
-
13
-
14
-
15
-
16
-
17
-
18
-
19
-
20
-
21
-
22
-
23
-
24
-
25
-
26
-
27
-
28
-
29
-
30
-
31
-
32
-
33
-
34
-
35
-
36
-
37
-
38
-
39
-
40
-
41
-
42
-
43
-
44
-
45
-
 46
46 -
 47
47 -
 48
48 -
 49
49 -
 50
50 -
 51
51 -
 52
52 -
 53
53 -
 54
54 -
 55
55 -
 56
56 -
 57
57 -
 58
58 -
 59
59 -
 60
60 -
 61
61 -
 62
62 -
 63
63 -
 64
64 -
 65
65 -
 66
66 -
67
-
68
-
69
-
70
-
71
-
72
-
73
-
74
-
75
-
76
-
77
-
78
-
79
-
80
-
81
-
82
-
83
-
84
-
85
-
86
-
87
-
88
-
89
-
90
-
91
-
92
-
93
-
94
-
95
-
96
-
97
-
98
-
99
-
100
-
101
-
102
-
103
-
104
-
105
-
106
-
107
-
108
-
109
-
110
-
111
-
112
-
113
-
114
-
115
-
116
-
117
-
118
-
119
-
120
-
121
-
122
-
123
-
124
-
125
-
126
-
127
-
128
-
129
-
130
-
131
-
132
-
133
-
134
-
135
-
136
-
137
-
138
-
139
-
140
-
141
-
142
-
143
-
144
-
145
-
146
-
147
-
148
-
149
-
150
-
151
-
152
-
153
-
154
-
155
-
156
-
157
-
158
-
159
-
160
-
161
-
162
-
163
-
164
-
165
-
166
-
167
-
168
 |
 |

HEWLETT-PACKARD COMPANY AND SUBSIDIARIES
Management’s Discussion and Analysis of
Financial Condition and Results of Operations (Continued)
operating expenses as a percentage of net revenue and an increase in gross margin. We recorded
$57 million of workforce reduction costs in the first two quarters of fiscal 2005. Our reduced operating
expenses reflected the benefits of these measures as well as management controls on expense spending,
which offset the impact of the higher employee bonus accruals recorded in the second half of the year.
The improvement in margin was due primarily to higher option attach rates and improved discount
management, which were offset partially by the continued mix shift towards industry standard servers
within the segment as well as the ongoing mix shift to lower margin products within the business
critical systems business as Integrity products assumed a greater percentage of business critical systems
net revenue. In addition, the year-over-year industry standard servers and storage gross margins
comparisons were favorably impacted by execution issues and business challenges that unfavorably
affected the performance of industry standard servers and storage in the second half of fiscal 2004.
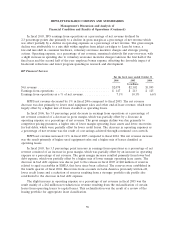
HP Services
For the fiscal years ended October 31
2006 2005 2004
In millions
Net revenue ......................................... $15,617 $15,536 $13,848
Earnings from operations ............................... $ 1,507 $ 1,151 $ 1,282
Earnings from operations as a % of net revenue .............. 9.6% 7.4% 9.3%
The components of weighted average net revenue growth, by business unit, were as follows for the
following fiscal years ended October 31:
2006 2005
Percentage points
Technology services ............................................... (1.0) 5.6
Managed services ................................................. 1.2 4.2
Consulting and integration .......................................... 0.3 2.3
Other ......................................................... — 0.1
Total HPS ...................................................... 0.5 12.2
HPS net revenue increased 1% in fiscal 2006 from fiscal 2005. On a constant currency basis, HPS
net revenue increased 2% in fiscal 2006 from fiscal 2005. In fiscal year 2006, the unfavorable currency
impact was due primarily to the movement of the dollar against the euro and the yen.
Net revenue in technology services decreased 2% in fiscal 2006 from the prior year due primarily
to declines related to competitive pricing pressures and changes in the mix of platforms being serviced.
This decline was moderated by growth in our IT solutions business such as integrated support services.
52