HP 2006 Annual Report Download - page 62
Download and view the complete annual report
Please find page 62 of the 2006 HP annual report below. You can navigate through the pages in the report by either clicking on the pages listed below, or by using the keyword search tool below to find specific information within the annual report.-
 1
1 -
2
-
3
-
4
-
5
-
6
-
7
-
8
-
9
-
10
-
11
-
12
-
13
-
14
-
15
-
16
-
17
-
18
-
19
-
20
-
21
-
22
-
23
-
24
-
25
-
26
-
27
-
28
-
29
-
30
-
31
-
32
-
33
-
34
-
35
-
36
-
37
-
38
-
39
-
40
-
41
-
42
-
43
-
44
-
45
-
46
-
47
-
48
-
49
-
50
-
51
-
 52
52 -
 53
53 -
 54
54 -
 55
55 -
 56
56 -
 57
57 -
 58
58 -
 59
59 -
 60
60 -
 61
61 -
 62
62 -
 63
63 -
 64
64 -
 65
65 -
 66
66 -
 67
67 -
 68
68 -
 69
69 -
 70
70 -
 71
71 -
 72
72 -
73
-
74
-
75
-
76
-
77
-
78
-
79
-
80
-
81
-
82
-
83
-
84
-
85
-
86
-
87
-
88
-
89
-
90
-
91
-
92
-
93
-
94
-
95
-
96
-
97
-
98
-
99
-
100
-
101
-
102
-
103
-
104
-
105
-
106
-
107
-
108
-
109
-
110
-
111
-
112
-
113
-
114
-
115
-
116
-
117
-
118
-
119
-
120
-
121
-
122
-
123
-
124
-
125
-
126
-
127
-
128
-
129
-
130
-
131
-
132
-
133
-
134
-
135
-
136
-
137
-
138
-
139
-
140
-
141
-
142
-
143
-
144
-
145
-
146
-
147
-
148
-
149
-
150
-
151
-
152
-
153
-
154
-
155
-
156
-
157
-
158
-
159
-
160
-
161
-
162
-
163
-
164
-
165
-
166
-
167
-
168
 |
 |

HEWLETT-PACKARD COMPANY AND SUBSIDIARIES
Management’s Discussion and Analysis of
Financial Condition and Results of Operations (Continued)
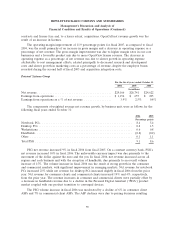
In fiscal 2005, IPG earnings from operations as a percentage of net revenue declined by
2.3 percentage points due primarily to a decline in gross margin as a percentage of net revenue which
was offset partially by a decline in operating expenses as a percentage of net revenue. The gross margin
decline was attributable to a mix shift within supplies from inkjet cartridges to LaserJet toner, a
low-end mix shift in consumer hardware, voluntary severance incentive charges and strategic pricing
actions. Operating expense, as a percentage of net revenue, remained relatively flat year-over-year, with
a slight increase in spending due to voluntary severance incentive charges taken in the first half of the
fiscal year and the second half of the year employee bonus expense offsetting the favorable impact of
headcount reductions and lower program spending in research and development.
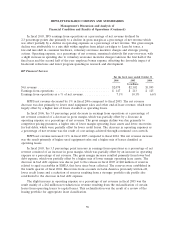
HP Financial Services
For the fiscal years ended October 31
2006 2005 2004
In millions
Net revenue ......................................... $2,078 $2,102 $1,895
Earnings from operations ............................... $ 147 $ 213 $ 125
Earnings from operations as a % of net revenue ............... 7.1% 10.1% 6.6%
HPFS net revenue decreased by 1% in fiscal 2006 compared to fiscal 2005. The net revenue
decrease was due primarily to lower used equipment sales and other end-of-lease revenue, which were
largely offset by a higher mix of leases classified as operating leases.
In fiscal 2006, the 3.0 percentage point decrease in earnings from operations as a percentage of
net revenue consisted of a decrease in gross margin, which was partially offset by a decrease in
operating expense as a percentage of net revenue. The gross margin decline was due primarily to
competitor pricing pressures, a higher mix of lower margin operating lease assets and lower recoveries
for bad debts, which were partially offset by lower credit losses. The decrease in operating expenses as
a percentage of net revenue was the result of cost savings achieved through continued cost controls.
HPFS net revenue increased 11% in fiscal 2005 compared to fiscal 2004. The net revenue increase
was the result primarily of higher used equipment sales and a higher mix of leases classified as
operating leases.
In fiscal 2005, the 3.5 percentage point increase in earnings from operations as a percentage of net
revenue consisted of an increase in gross margin, which was partially offset by an increase in operating
expense as a percentage of net revenue. The gross margin increase resulted primarily from lower bad
debt expense, which was partially offset by a higher mix of lower margin operating lease assets. The
decrease in bad debt expense was due in part to the release in fiscal 2005 of $40 million of reserves
related to aged receivables in EMEA that have since been collected. The reserves were established in
the fourth quarter of fiscal 2004. Recoveries from accounts in Latin America previously written-off,
lower credit losses and a reduction of reserves resulting from a stronger portfolio risk profile also
contributed to the decrease in bad debt expense.
The slight increase in operating expense as a percentage of net revenue in fiscal 2005 was the
result mainly of a $62 million net reduction in revenue resulting from the reclassification of certain
leases from operating leases to capital leases. This reclassification was the result of a review of the
leasing portfolio for appropriate lease classification.
58