HP 2006 Annual Report Download - page 66
Download and view the complete annual report
Please find page 66 of the 2006 HP annual report below. You can navigate through the pages in the report by either clicking on the pages listed below, or by using the keyword search tool below to find specific information within the annual report.-
 1
1 -
2
-
3
-
4
-
5
-
6
-
7
-
8
-
9
-
10
-
11
-
12
-
13
-
14
-
15
-
16
-
17
-
18
-
19
-
20
-
21
-
22
-
23
-
24
-
25
-
26
-
27
-
28
-
29
-
30
-
31
-
32
-
33
-
34
-
35
-
36
-
37
-
38
-
39
-
40
-
41
-
42
-
43
-
44
-
45
-
46
-
47
-
48
-
49
-
50
-
51
-
52
-
53
-
54
-
55
-
 56
56 -
 57
57 -
 58
58 -
 59
59 -
 60
60 -
 61
61 -
 62
62 -
 63
63 -
 64
64 -
 65
65 -
 66
66 -
 67
67 -
 68
68 -
 69
69 -
 70
70 -
 71
71 -
 72
72 -
 73
73 -
 74
74 -
 75
75 -
 76
76 -
77
-
78
-
79
-
80
-
81
-
82
-
83
-
84
-
85
-
86
-
87
-
88
-
89
-
90
-
91
-
92
-
93
-
94
-
95
-
96
-
97
-
98
-
99
-
100
-
101
-
102
-
103
-
104
-
105
-
106
-
107
-
108
-
109
-
110
-
111
-
112
-
113
-
114
-
115
-
116
-
117
-
118
-
119
-
120
-
121
-
122
-
123
-
124
-
125
-
126
-
127
-
128
-
129
-
130
-
131
-
132
-
133
-
134
-
135
-
136
-
137
-
138
-
139
-
140
-
141
-
142
-
143
-
144
-
145
-
146
-
147
-
148
-
149
-
150
-
151
-
152
-
153
-
154
-
155
-
156
-
157
-
158
-
159
-
160
-
161
-
162
-
163
-
164
-
165
-
166
-
167
-
168
 |
 |
HEWLETT-PACKARD COMPANY AND SUBSIDIARIES
Management’s Discussion and Analysis of
Financial Condition and Results of Operations (Continued)
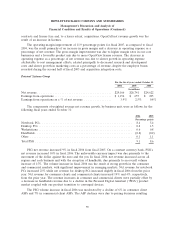
Days of purchases outstanding in accounts payable (‘‘DPO’’) measures the average number of days
our accounts payable balances are outstanding. DPO is calculated by dividing accounts payable by a
90-day average cost of goods sold.
Our working capital requirements depend upon our effective management of the cash conversion
cycle, which represents effectively the number of days that elapse from the day we pay for the purchase
of raw materials to the collection of cash from our customers. The cash conversion cycle is the sum of
DSO and DOS less DPO.
2006 Compared to 2005
Operating Activities
Net cash provided by operating activities increased by $3.3 billion during fiscal 2006. The increase
in our cash flow from operations was due primarily to higher earnings and lower payments for pension
and taxes, which were partially offset by higher payments for restructuring costs.
Investing Activities
Net cash used in investing activities increased by $1.0 billion during fiscal 2006 due primarily to
higher capital expenditures for property, plant and equipment, lower net proceeds from maturities and
sales of investments and higher cash paid for acquisitions.
Financing Activities
Net cash used in financing activities increased by $1.1 billion during fiscal 2006 as compared to
fiscal 2005. The increase was due primarily to a $2.5 billion increase in repurchases of common stock
and a $1.7 billion prepayment for common stock to be repurchased in future periods. These
expenditures were partially offset by a $1.6 billion net increase to financing activities resulting from
higher borrowings and lower debt payments and $1.4 billion increased proceeds from the issuance of
common stock related to our employee stock plans mainly due to increased exercises of employee stock
options as a result of higher market prices for our common stock during fiscal 2006.
We repurchase shares of our common stock under an ongoing program to manage the dilution
created by shares issued under employee benefit plans as well as to repurchase shares opportunistically.
This program authorizes repurchases in the open market or in private transactions. In fiscal 2006, we
completed share repurchases of approximately 188 million shares. Approximately 190 million shares
were settled for $6.1 billion, which included 2 million shares repurchased in transactions that were
executed in fiscal 2005 but settled in fiscal 2006, as compared to approximately 150 million shares
repurchased, of which 148 million shares were settled for $3.5 billion in fiscal 2005.
In addition to the shares we repurchased, we received approximately 34 million shares for an
aggregate price of $1.1 billion under a prepaid variable share purchase program (‘‘PVSPP’’) entered
into with a third-party investment bank during the first quarter of 2006. Under the PVSPP, we prepaid
$1.7 billion in the first quarter of fiscal 2006 in exchange for the right to receive a variable number of
shares of our common stock weekly over a one year period beginning in the second quarter of fiscal
2006 and ending during the second quarter of fiscal 2007. We recorded the payment as a prepaid stock
repurchase in the stockholders’ equity section of our Consolidated Balance Sheet and included the
payment in the cash flows from financing activities in the Consolidated Statement of Cash Flows. In
connection with this program, the investment bank has purchased and will continue to trade shares of
62