HP 2006 Annual Report Download - page 39
Download and view the complete annual report
Please find page 39 of the 2006 HP annual report below. You can navigate through the pages in the report by either clicking on the pages listed below, or by using the keyword search tool below to find specific information within the annual report.-
 1
1 -
2
-
3
-
4
-
5
-
6
-
7
-
8
-
9
-
10
-
11
-
12
-
13
-
14
-
15
-
16
-
17
-
18
-
19
-
20
-
21
-
22
-
23
-
24
-
25
-
26
-
27
-
28
-
 29
29 -
 30
30 -
 31
31 -
 32
32 -
 33
33 -
 34
34 -
 35
35 -
 36
36 -
 37
37 -
 38
38 -
 39
39 -
 40
40 -
 41
41 -
 42
42 -
 43
43 -
 44
44 -
 45
45 -
 46
46 -
 47
47 -
 48
48 -
 49
49 -
50
-
51
-
52
-
53
-
54
-
55
-
56
-
57
-
58
-
59
-
60
-
61
-
62
-
63
-
64
-
65
-
66
-
67
-
68
-
69
-
70
-
71
-
72
-
73
-
74
-
75
-
76
-
77
-
78
-
79
-
80
-
81
-
82
-
83
-
84
-
85
-
86
-
87
-
88
-
89
-
90
-
91
-
92
-
93
-
94
-
95
-
96
-
97
-
98
-
99
-
100
-
101
-
102
-
103
-
104
-
105
-
106
-
107
-
108
-
109
-
110
-
111
-
112
-
113
-
114
-
115
-
116
-
117
-
118
-
119
-
120
-
121
-
122
-
123
-
124
-
125
-
126
-
127
-
128
-
129
-
130
-
131
-
132
-
133
-
134
-
135
-
136
-
137
-
138
-
139
-
140
-
141
-
142
-
143
-
144
-
145
-
146
-
147
-
148
-
149
-
150
-
151
-
152
-
153
-
154
-
155
-
156
-
157
-
158
-
159
-
160
-
161
-
162
-
163
-
164
-
165
-
166
-
167
-
168
 |
 |
ITEM 7. Management’s Discussion and Analysis of Financial Condition and Results of Operations.
HEWLETT-PACKARD COMPANY AND SUBSIDIARIES
Management’s Discussion and Analysis of
Financial Condition and Results of Operations
The following discussion should be read in conjunction with the Consolidated Financial Statements
and the related notes that appear elsewhere in this document.
OVERVIEW
We are a leading global technology company and generate net revenue and earn our profits from
the sale of products, technologies, solutions and services to consumers, businesses and governments.
Our portfolio is broad and includes personal computers, handheld computing devices, home and
business imaging and printing devices, publishing systems, storage and servers, a wide array of
information technology (‘‘IT’’) services and software solutions. We have seven business segments:
Enterprise Storage and Servers (‘‘ESS’’), HP Services (‘‘HPS’’), Software, the Personal Systems Group
(‘‘PSG’’), the Imaging and Printing Group (‘‘IPG’’), HP Financial Services (‘‘HPFS’’), and Corporate
Investments. ESS, HPS and Software are structured beneath a broader Technology Solutions Group
(‘‘TSG’’). While TSG is not an operating segment, we sometimes provide financial data aggregating the
segments within TSG in order to provide a supplementary view of our business.
Our product and geographic breadth requires us to focus on strategic imperatives within individual
product categories and to manage across our portfolio in order to drive growth while optimizing cost
structure. Our financial results also are impacted by our ability to predict and to respond to
industry-wide trends. For instance, a trend that is significant to our business and financial results is the
shift toward standardized products, which presents revenue opportunities for certain of our businesses
but presents an ongoing challenge to our margins. To help address the potential margin impact of
standardization, we take ongoing actions related to both revenue generation and cost structure
management. In the sales and marketing area, we have programs designed to improve the rates at
which we sell higher-margin configurations or options. We also continue to focus on managing
procurement and labor expenses. Key to our overall efforts in delivering superior products while
maintaining a world-class cost structure is the increasingly global nature of technology expertise. This
trend is allowing us to develop a global delivery structure to take advantage of regions where advanced
technical expertise is available at lower costs.
As part of our efforts to improve efficiencies and reduce costs, we continually evaluate our
workforce and infrastructure and make adjustments we deem appropriate. When we make adjustments
to our workforce and infrastructure, we may incur incremental expenses that delay the benefit of a
more efficient workforce structure, but we believe that the fundamental shift to more efficient global
delivery is crucial to maintaining a long-term competitive cost structure. Recent adjustments include:
• Our plans announced in May 2006 to reduce our IT spending by consolidating 85 data centers
worldwide into six state-of-the-art centers in three U.S. cities; and
• Our plans announced in July 2006 to reduce our real estate costs by consolidating several
hundred real estate locations worldwide to fewer core sites over the next four years.
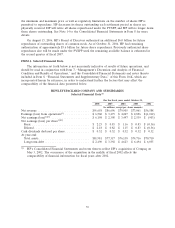
We continue to implement the 2005 restructuring plan that was approved by our Board of
Directors in the fourth quarter of fiscal 2005. As part of that plan, we announced in June 2006 that we
would integrate the activities carried out by our Global Operations organization directly into our
business segments. Under the 2005 restructuring plan, we expect to eliminate approximately 15,200
positions through workforce restructuring or early retirement programs. Approximately 14,200 of these
positions have been eliminated as of October 31, 2006. The majority of the remaining 1,000 positions
35